

EventDrops 0.2 is out!

We are proud to announce the new 0.2.0 release of EventDrops, one of our visualization tools dedicated to time series. So... What's new in this new version?
Big Rewrite For Community Sake
We took a long time to update the library because of the source code structure. It was composed of a few files, with a big one dealing with all the drops logic. To be honest, it was pretty hard to get back into, and it needed a serious refactoring. That's what we did, taking advantage of one of our marmelab hackday.
After spending several days working on it, EventDrops is now written in full ES6, allowing to considerably ease development. But don't worry about browser compatibility, the compiled library is still transpiled in ES5, to be understandable by every modern browser.
We had several issues with the former Gulp file. We now use Webpack for both development and build. Once again, it shouldn't change anything for EventDrops developers, as we updated the Makefile to keep the same commands as before: make run and make build. As a result, thanks to the webpack-dev-server, browser reload is faster than ever when you save your file changes.
Finally, we fixed several regression that appeared quite some time ago. And, to fix them once and for all, we added more automated tests, ensuring the features won't break again in the future.
The code is now more decoupled, more tested, and therefore more maintainable. If you were scared about submitting a PR on it, don't be anymore. :)
Adding a new onClick Event Handler
Thanks to Chad Ramos, you can now add code to be executed when users click on a drop. It's as simple as calling the eventClick function:
const chart = d3.chart.eventDrops().eventClick(d => {
  // d is currently only the drop date...
  // more on it in the roadmap section below
  console.log("Clicked!", d);
});
Also note that some regressions about event handlers have been fixed. onHover and onZoomend events are now working again, and double click on a drop does not trigger an error anymore, thanks to Joan Yin.
Metaballs
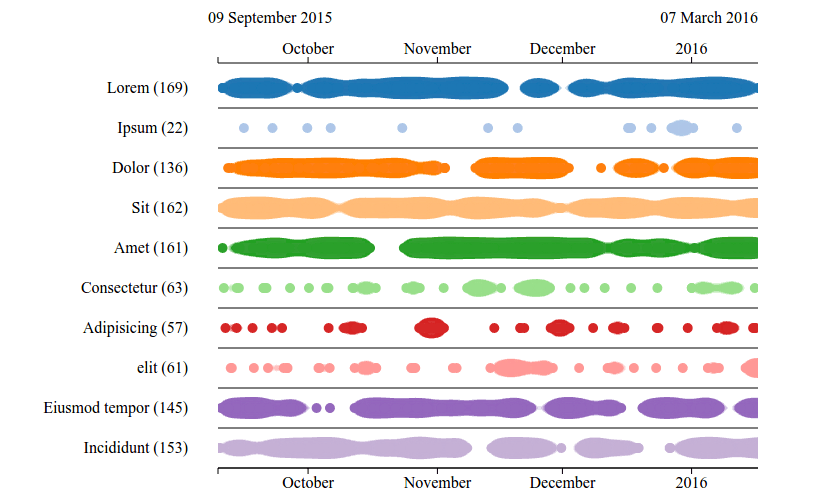
Another major change comes from Mélodie Benmouffek, our intern: the metaballs feature. Instead of just displaying drops as circles, using semi-transparency to show accumulation, EventDrops now merges close events together to form a larger cluster. The event accumulation becomes visually obvious, and it eases the detection of patterns in the events distribution.

This eye-candy display is now the default one. However, if you want to fallback to the former behavior, you just have to specify it in the configuration:
d3.chart.eventDrops().metaballs(false);It then produces a dot-chart:

Publishing a Live Demo
If you want to test EventDrops on a live preview, we published a demo, updated regularly to match the latest changes in the repository. This page still needs some love (at least for the styling, which is currently quite raw), but it allows to interact easily with the chart.
For the most curious, we automated the way the demo is deployed on GitHub pages, using the following Makefile task:
deploy-demo: build
	mkdir -p demo/dist/
	cp ./dist/* demo/dist/
	cp ./node_modules/d3/d3.min.js demo/dist/
	git add demo/
	git commit -m "Update GitHub pages"
	git push origin :gh-pages
	git subtree push --prefix demo origin gh-pages
	git reset --soft HEAD~1 # undo the deployment commit
	git reset HEAD demo
	rm -Rf demo/dist/
The most interesting command here is git subtree. It allows to push only a subset of directories (here the demo folder) to the remote branch gh-pages. Yes, it sounds scary... but it seems to work well after several deployments. :) Other commands are just some automated commits and resets.
What's Next on our Roadmap?
Version 0.2 aimed at strengthening the current code base, adding more tests, and becoming more developer friendly. Yet, it brings little value to end users. We identified a major missing point: the possibility to access more data than only the drop date in all configuration functions. With the next version, you should be able to use something like:
d3.chart
  .eventDrops()
  .eventColor(d => (d.type === "danger" ? "red" : "green"))
  .eventClick(d =>
    console.log(`${d.eventName} on ${d.location} due to ${d.user} intervention`)
  );
We will also probably change the configuration file a little bit, using more standard names, such as onClick instead of eventClick, or allowing to change metaballs basic parameters, such as thickness.
These are the points we identified with the feedbacks you gave us. Yet, you perhaps miss some other features. Don't hesitate to give us your use cases. Your experience is the most valuable fuel to move this project forward.
