
Are No-Code Tools A Good Choice For Developers?

Developers often use low-code tools like React-Admin to increase their development speed. But what about no-code tools? How far can they get and are they nice to use?
As an experiment, I decided to try replicating the React-Admin demo using a no-code tool. This e-commerce demo shows an admin for a fictional poster shop. I chose the most popular no-code platform, Retool. My goal is to see if it is possible to replicate the functionality of a developer tool using a no-code approach. Stay tuned to see how it turns out!
YouTube might track you and we would rather have your consent before loading this video.
Working With A Fake API
Before diving into no-code, I need to set up an API that Retool can use. To do this, I have to write some code - but it’s for testing purposes, and it should be the only code in this post. I use the e-commerce fake data generator published with react-admin, along with JSON Server to create the API, and ngrok to expose it.
import cors from "cors";import generateData from "data-generator-retail";import jsonServer from "json-server";import ngrok from "ngrok";
const data = generateData();
const server = jsonServer.create();const router = jsonServer.router(data);
server.use(  cors({    origin: true,    credentials: true,    preflightContinue: false,    methods: "GET,HEAD,PUT,PATCH,POST,DELETE",  }),);server.use(router);
server.listen(3000, async () => {  console.log("JSON Server is running locally");  const url = await ngrok.connect({    addr: 3000,  });  console.log(`JSON Server is running remotely at ${url}`);});
Now I have an API running locally and accessible from the outside via a ngrok.io URL:
$ curl localhost:3000/products/1{ "id": 1, "category_id": 0, "reference": "Dog Grass", "width": 25.49, "height": 16.38, "price": 23.51, "thumbnail": "https://marmelab.com/posters/animals-2.jpeg", "image": "https://marmelab.com/posters/animals-2.jpeg", "description": "Porro iure odio itaque ut ab aut nobis eos. Quia neque non nihil rem. Consequuntur asperiores nihil atque porro consequatur perferendis ea. Omnis recusandae quia et et. Natus aut non blanditiis voluptas officiis id aliquam. Natus et eum a.", "stock": 93, "sales": 19}Setting Up The API Connection
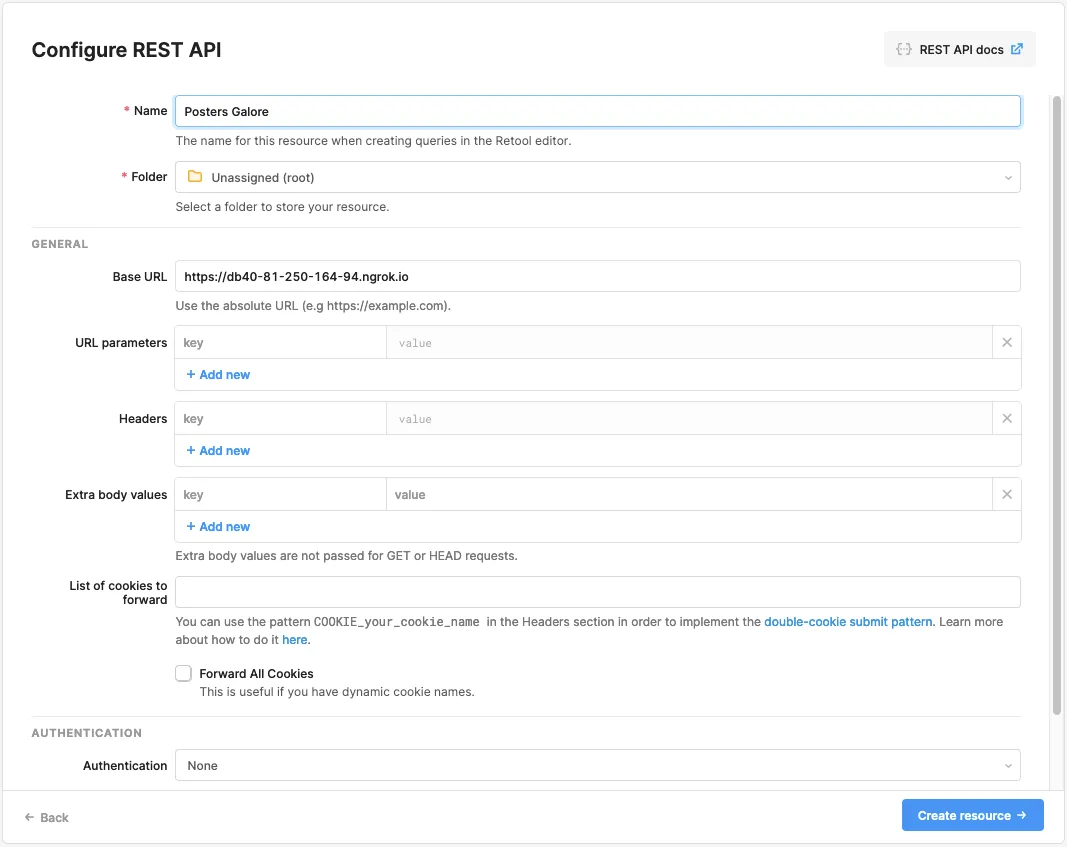
To access my API in Retool, I create a new resource of type REST API using the ngrok URL. I name this resource “Posters Galore”.
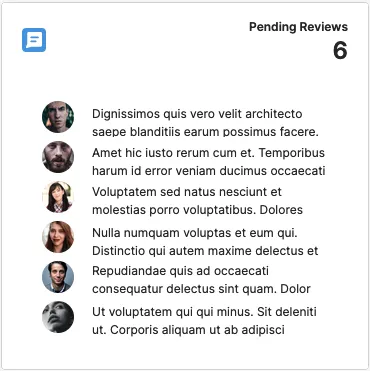
Creating The First Component
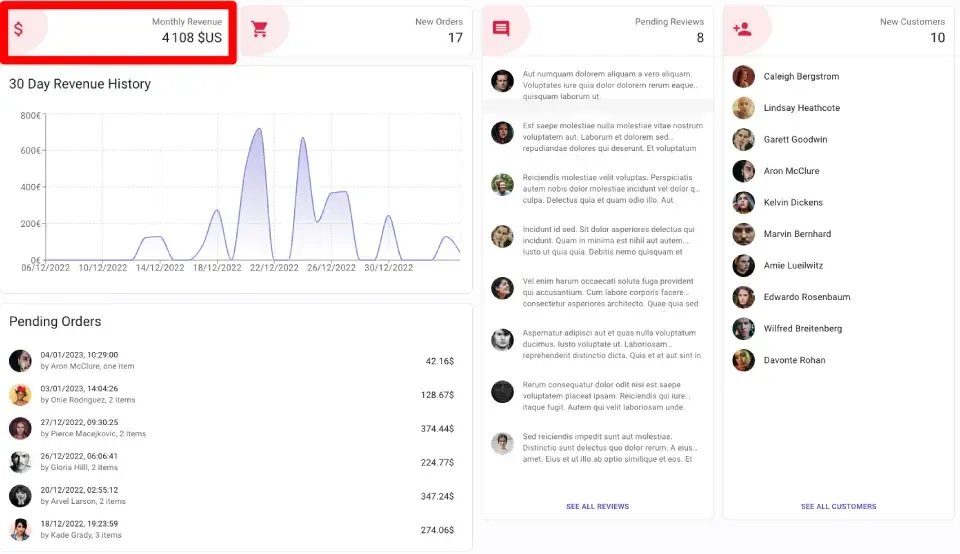
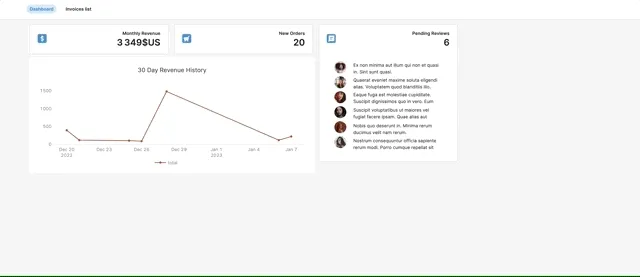
It’s time to start building the first component: the leftmost block of the top row in the demo dashboard, which displays the monthly revenue.
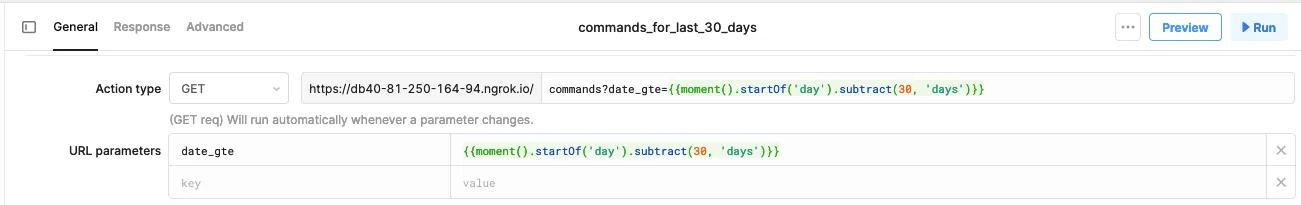
To begin, I create a new app in Retool and name it “Dashboard”. To display data in the component, I need to set up a query that retrieves the commands for the last 30 days. I name this query “commands_for_last_30_days” and use the “Posters Galore” resource and the commands endpoint.
In order to filter the results to the last 30 days, I need to set the date_gte URL parameter. For the value, Retool allows me to use a JavaScript expression with some included libraries like moment. This expression will return the date 30 days ago: {{moment().startOf('day').subtract(30, 'days')}}.
Next, I add a Statistic component to my app. To allow for more customization, such as changing the background color, I wrap it in a Container component. Using the sidebar, I can easily configure the Statistic component to meet my needs, such as adding a label and icon.
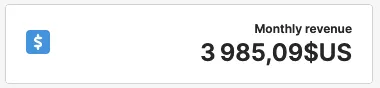
To set the displayed value, I select the commands_for_last_30_days query and use a JavaScript expression to compute the sum of the total field: {{commands_for_last_30_days.data.reduce((acc, command) => acc + command.total, 0)}}.
The first component that fetches the API and renders the result is now ready!
I can follow the same process to create the component that displays the number of orders in the last 30 days with the following displayed value: {{commands_for_last_30_days.data.length}}.
Displaying A List Of Records
The next component I want to build is the list of pending reviews.
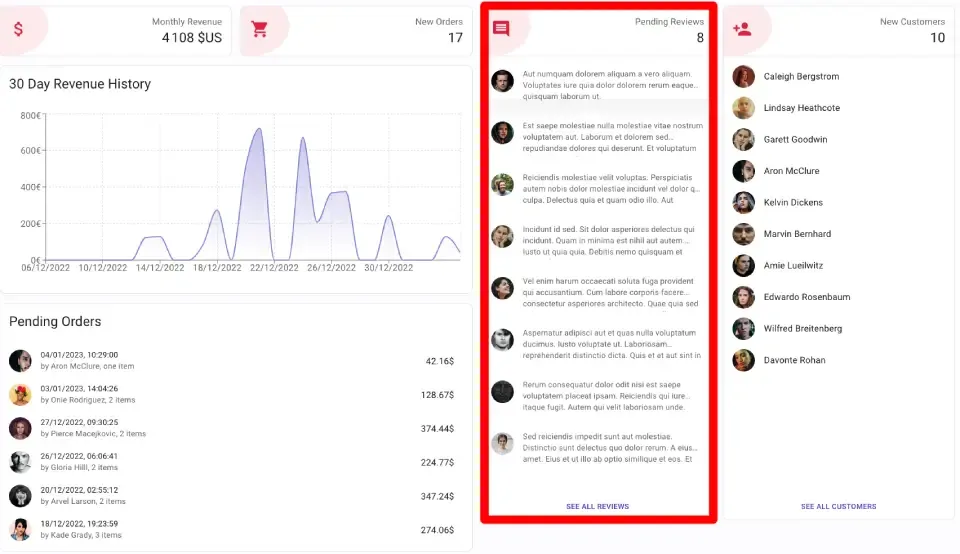
To do this, I need to create a pending_reviews query that retrieves all the reviews with a status of “pending”. Then, I use a List view component to display these reviews. To set the number of rows in the list view, I use the following expression: {{pending_reviews.data.length}}.
Then, I can put in the List view the compoents that will be used to display each row. In this case, it is an Avatar component and a Text component. In a row, we can use the i variable to access data of the current row. For example, to display the comment of the review in the Text component, I use the following expression: {{pending_reviews.data[i].comment}}.
To display the avatar, it is a little bit more complex because it is a relationship between reviews and customers. The pending_reviews query does not directly contain the customer’s avatar. To get the customer’s avatar, I need to create a new query that retrieves all customers with the ID of the review. I name this query customers and use the customers endpoint. I can now use the customers query to get the avatar of the customer who write the review in the Avatar component using the following expression: {{customers.data.find((customer) => customer.id === pending_reviews.data[i].customer_id).avatar}}.
The list of pending reviews is now ready!
The only problem is that it calls the API once for the reviews, and once for each review to fetch the author…
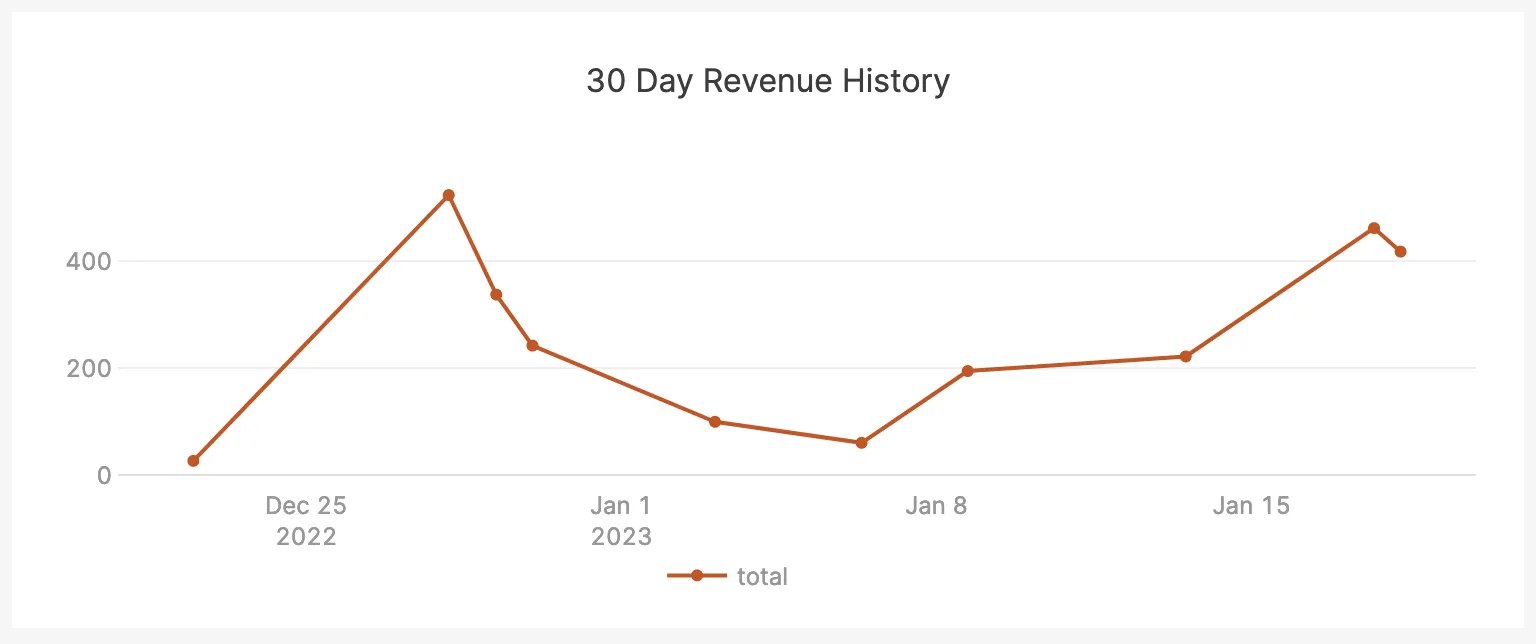
Displaying a chart
One key benefit of using no-code tools is their ability to effortlessly create complex elements such as charts, which can be challenging to accomplish with traditional coding methods. Let’s try this on the chart displaying the revenue from the last 30 days.
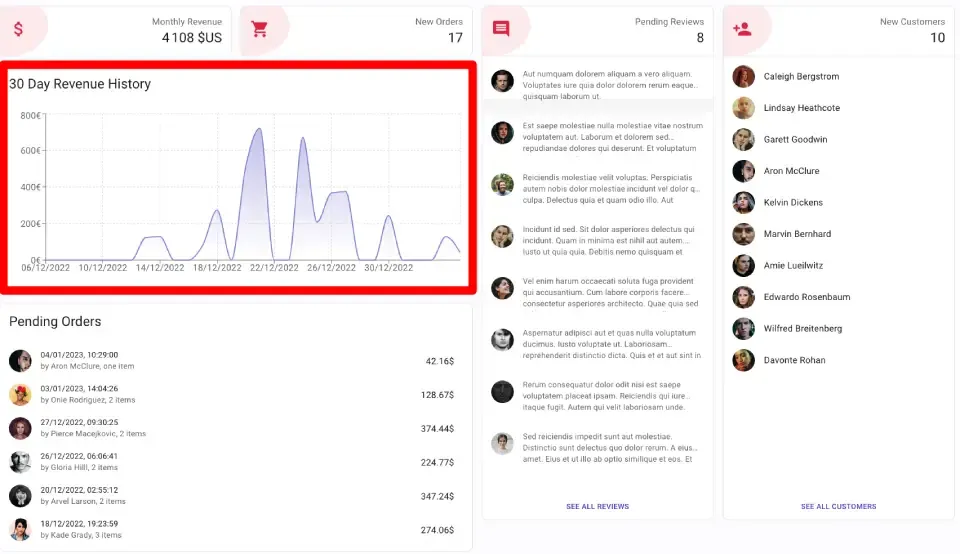
All I need to do is create the query invoices_for_last_30_days and use the chart component. With the sidebar, I can then select the invoices_for_last_30_days query as the data source, choose the Line chart type, and select to display only the total data from the query.
I have a problem when my query returns several invoices for the same day. To group invoices by day, I can directly transform the result of the query with some custom JavaScript code. For this particular case, I can accomplish this task with a reduce function.
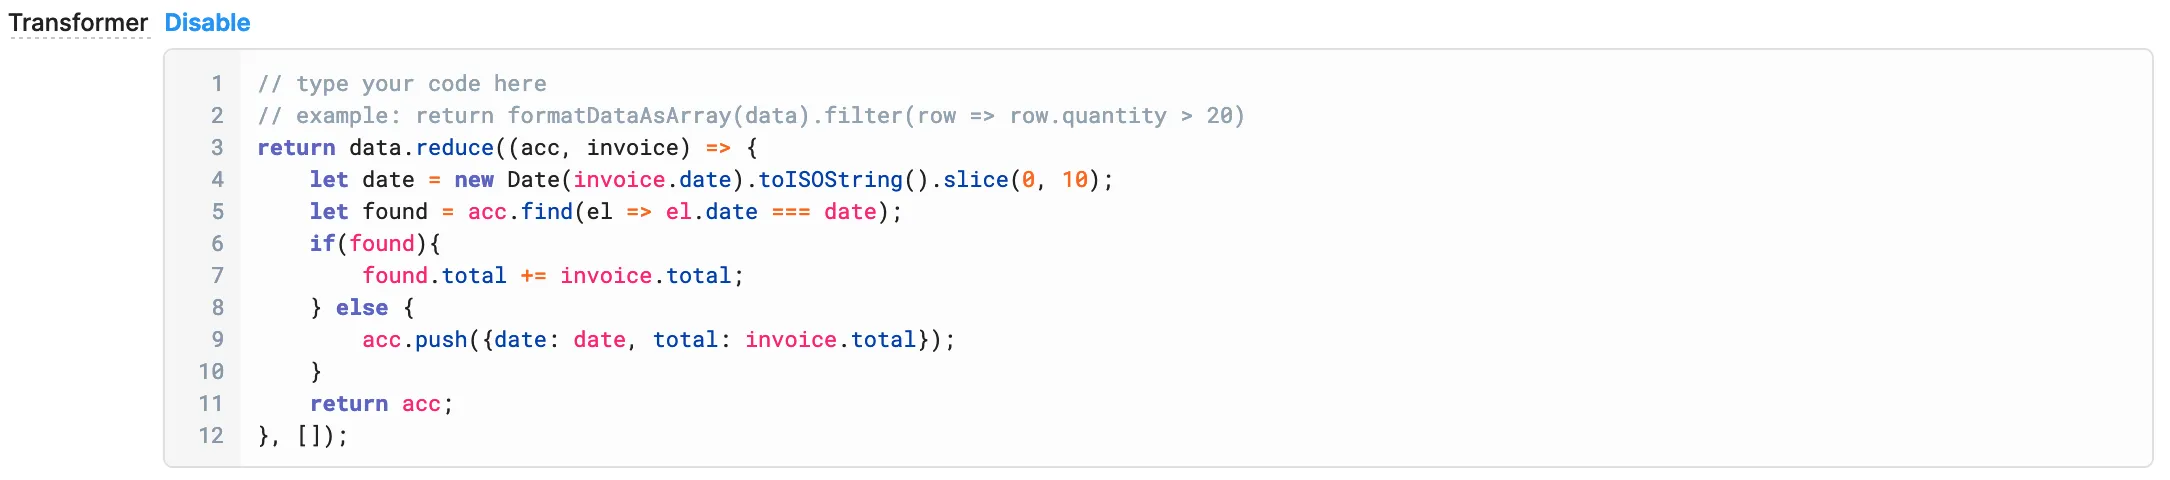
The chart is now ready!
Except I had to use JavaScript… Can a non-developer do that?
Building a Multi-Page App
Creating a dashboard is nice but I need to have other views in my admin app. The react-admin demo is a complete app showing orders, invoices, products, customers, reviews, etc.
Unfortunately, Retool does not allow to create multiple pages in a single app. To solve this problem, I have to create a new app.
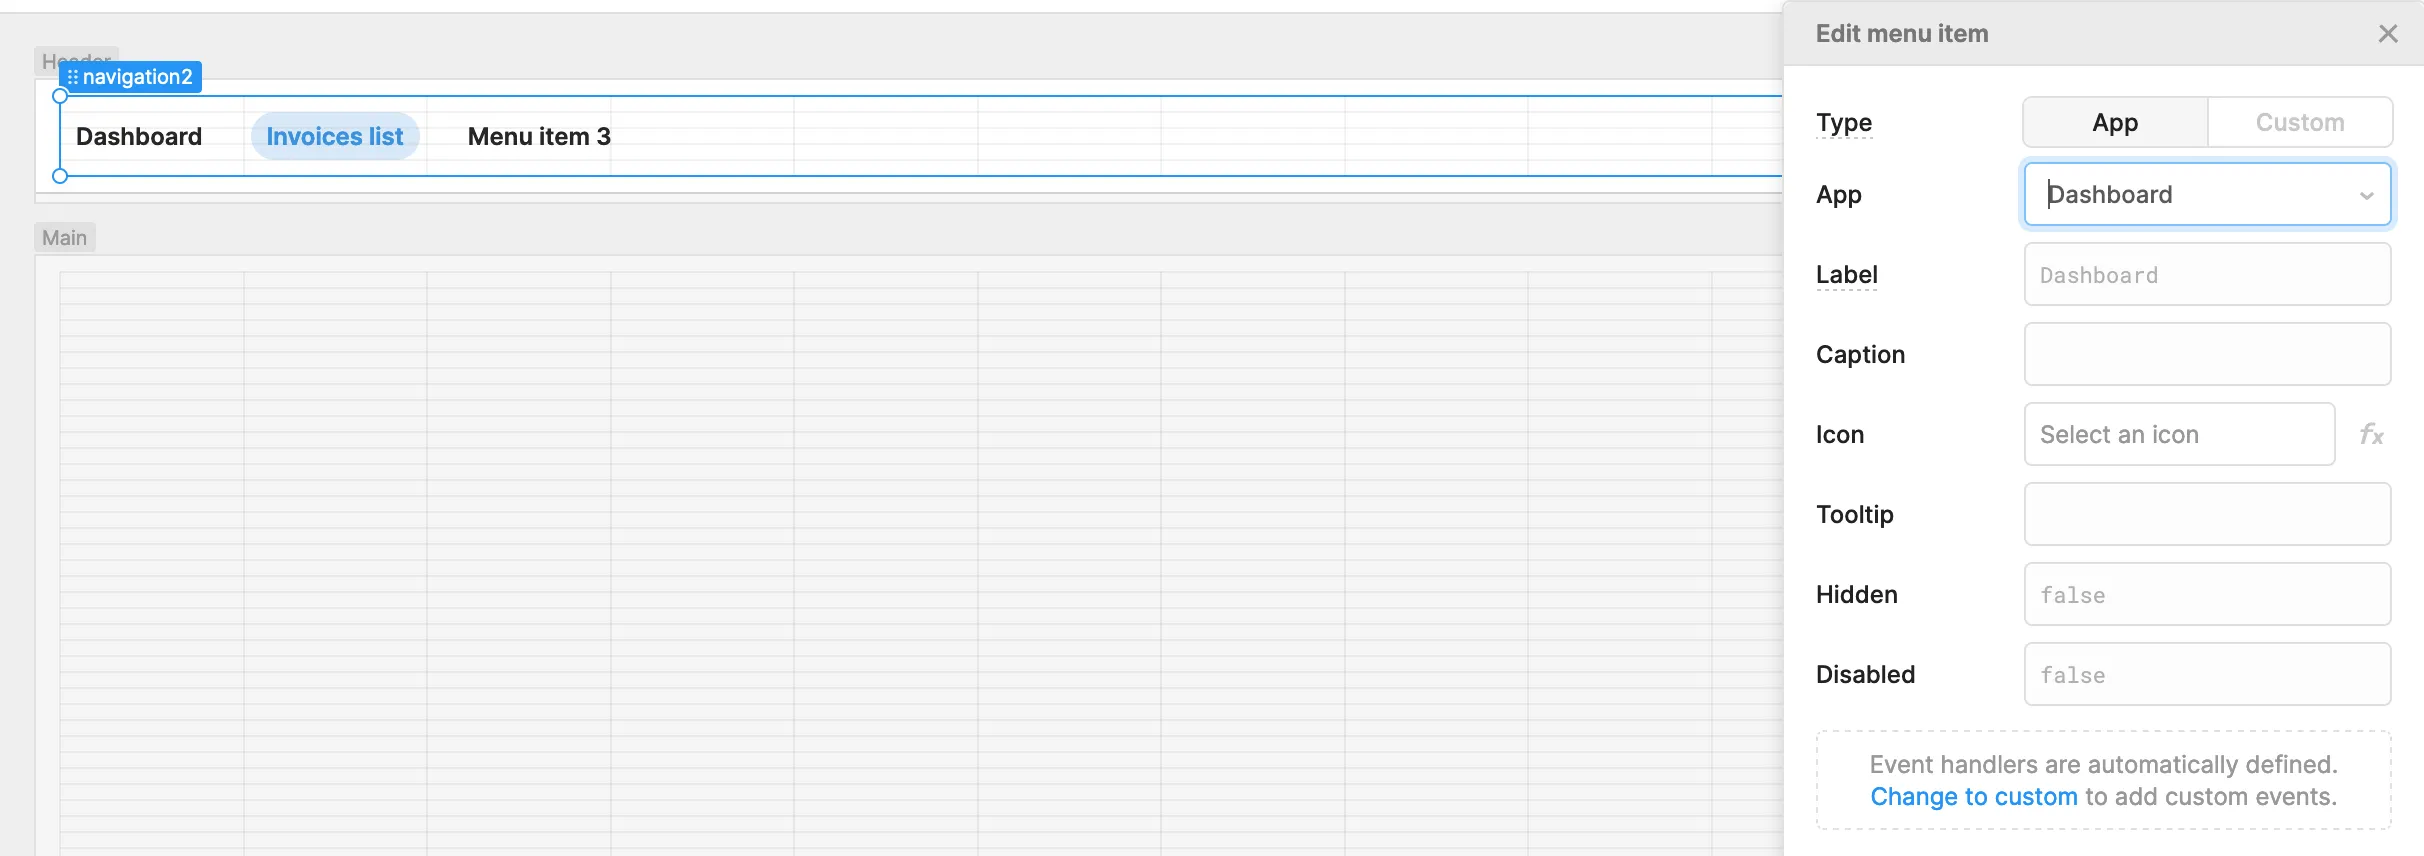
Let’s create a new app for the invoices list, that I name “Invoices list”. Then, I add a header to my app with the left sidebar. By default, the header contains a Navigation component. This is exactly what I need! With the right sidebar, I can easily configure each link of the navigation. For example, I can set the link to the dashboard app and the label to “Dashboard”.
This navigation has to be added in each separate app of my “multi-page” app. So, I also add it to the Dashboard app. Now, I can navigate between the two apps.
If some components have to be shared between several apps, it is probably better to use the Module features provided by Retool. The queries can also be shared by exporting them to the “Query library”.
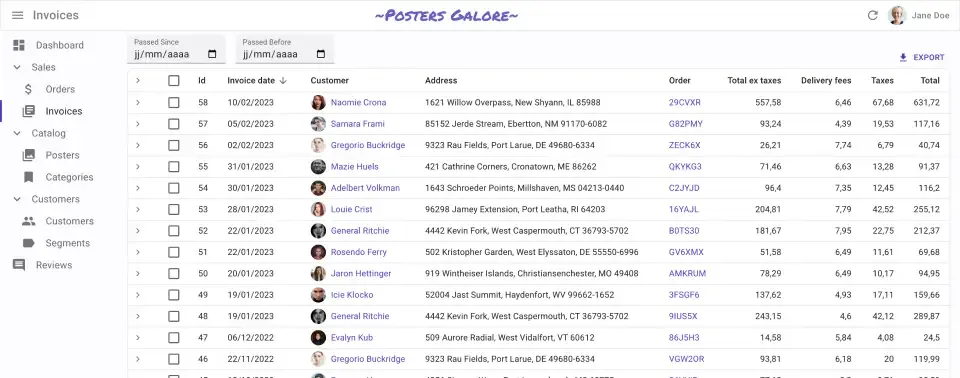
Creating A Table View
To create the invoices view, I first create a new query called invoices to retrieve all invoices, and use it in a Table component. Using the right sidebar, I can easily customize the column labels and select the fields to display in the table, such as hiding the tax_rate. The Table component also enables user to choose the sort field and add filters.
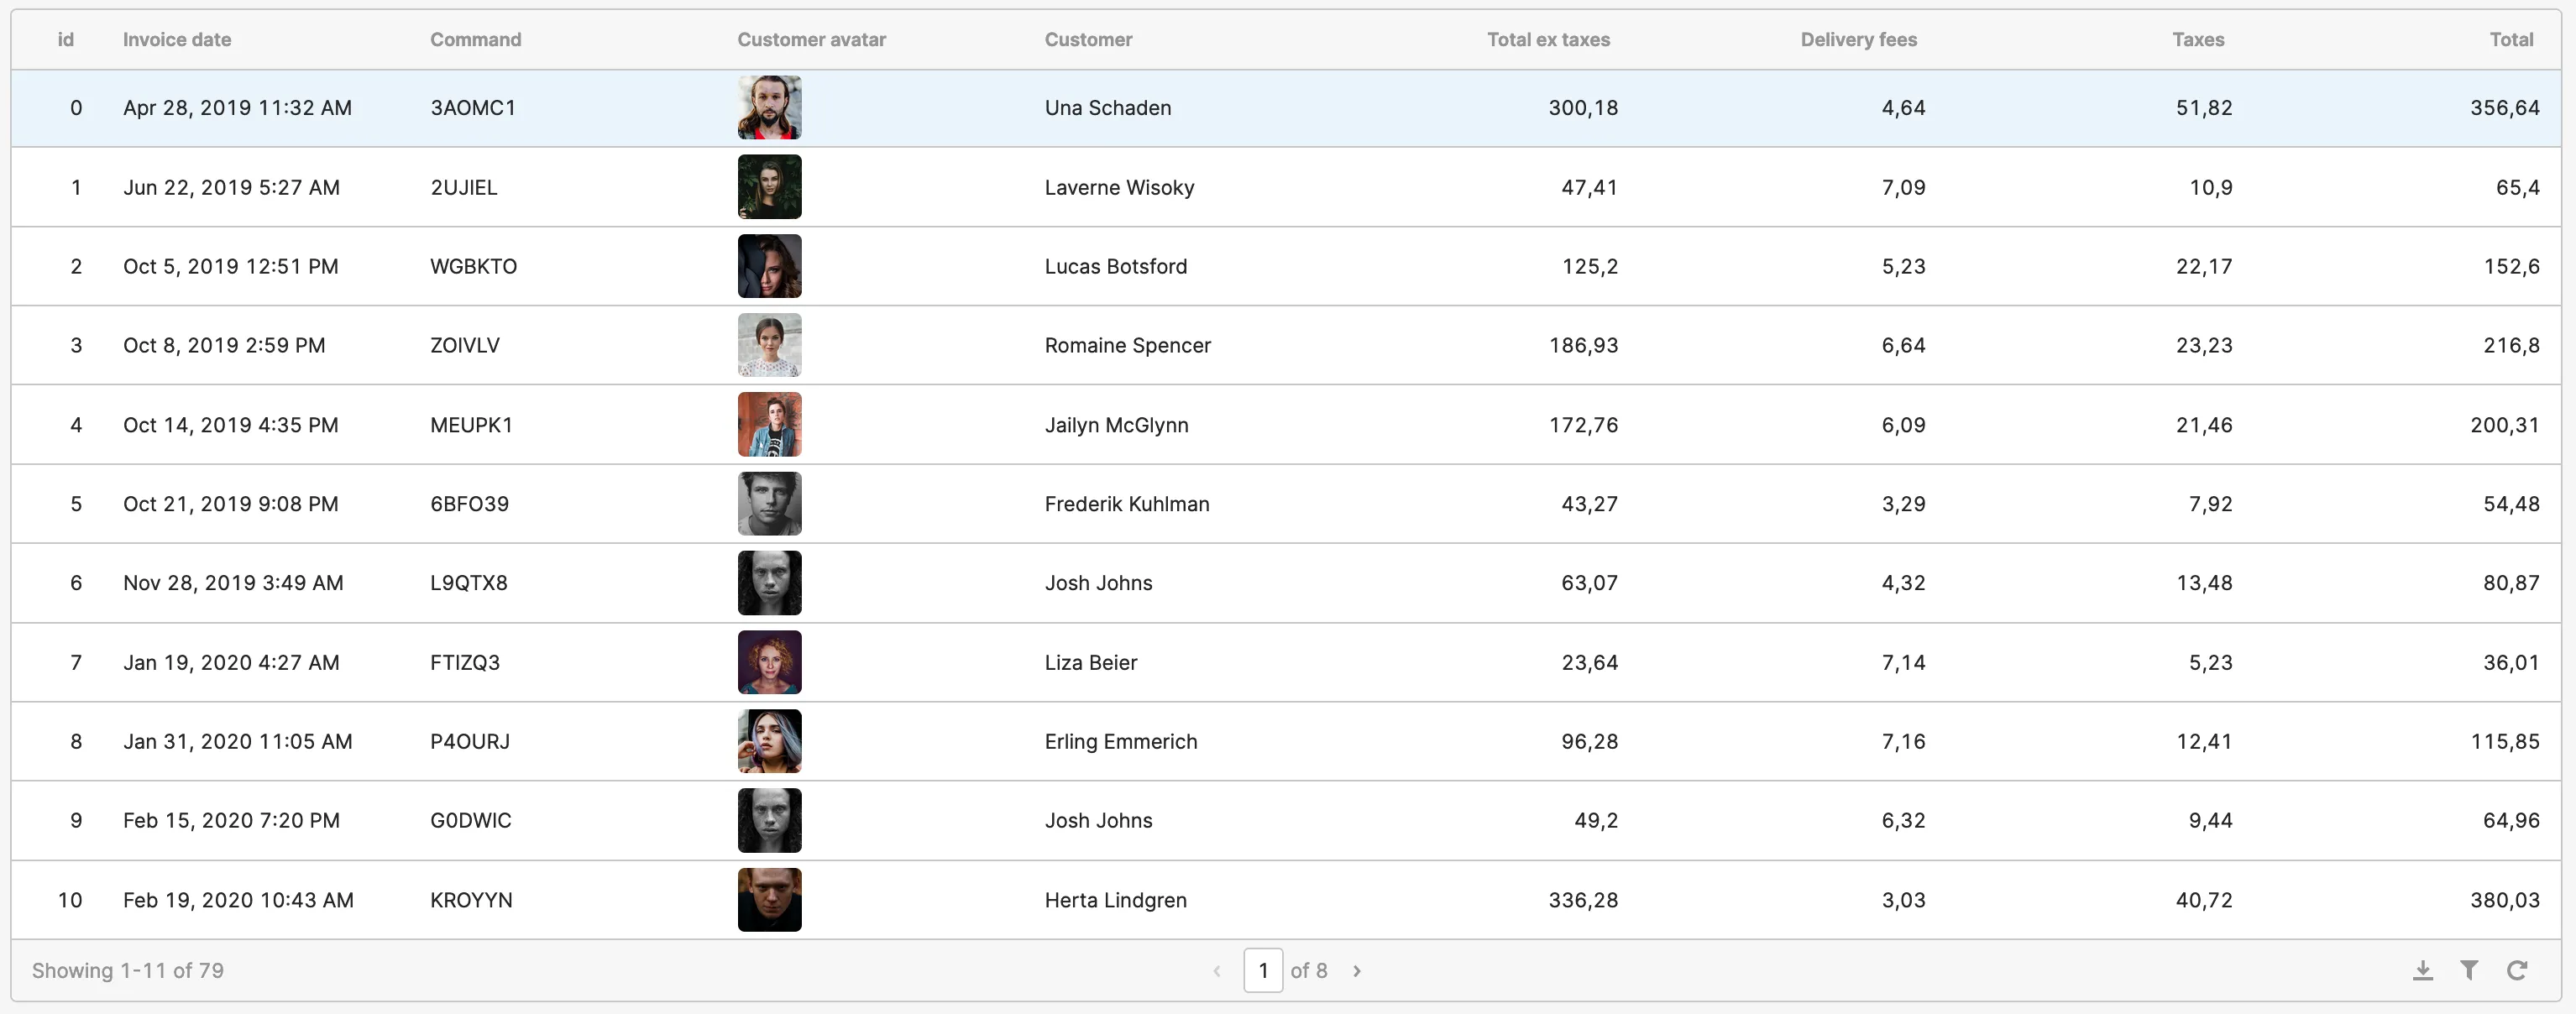
Currently, the order ID is visible in the table. To enhance the user experience, it would be great to directly display the order reference, similar to how the React Admin ReferenceField works. To achieve this, I have to create another query, orders to retrieve all orders. I can then add an “Order” column to the table and use JavaScript with the keyword currentRow to obtain the reference of the corresponding order ID:
{ { orders.data.find((order) => order.id === currentRow.order_id).reference; }}I would like to achieve a similar outcome with the customer ID by directly displaying the customer’s avatar in the table. Unfortunately, it appears that it is not possible to nest a component like the Avatar component within the Table component. However, it is possible to use Image URL as the column type. To display the avatar, I can use the following expression:
{ { customers.data.find((customer) => customer.id === currentRow.customer_id) .avatar; }}Additionally, I can create another column to display the customer’s name by using the following expression:
{ { customers.data.find((customer) => customer.id === currentRow.customer_id) .first_name; }}{ { customers.data.find((customer) => customer.id === currentRow.customer_id) .last_name; }}The invoices table is now ready!
But again, without basic coding knowledge, I would be very limited in terms of customization.
Adding Actions To A Table
In the invoices list, I would like to have actions to edit or delete an invoice. To do this, I can use the Actions feature of the Table component. With the right sidebar, I can add a new action which I name Delete and select a query to run for this action. In this case, I create the remove_invoice query. In the query endpoint, I can access to the table data, so my endpoint is invoices/{{ table1.data[i].id }}.
As this action is deleting an invoice, I want to refresh the table once the action is executed. I can achieve this by using the “Event handlers” of the query. I set it to trigger the invoices query upon the successful execution of the remove_invoice query.
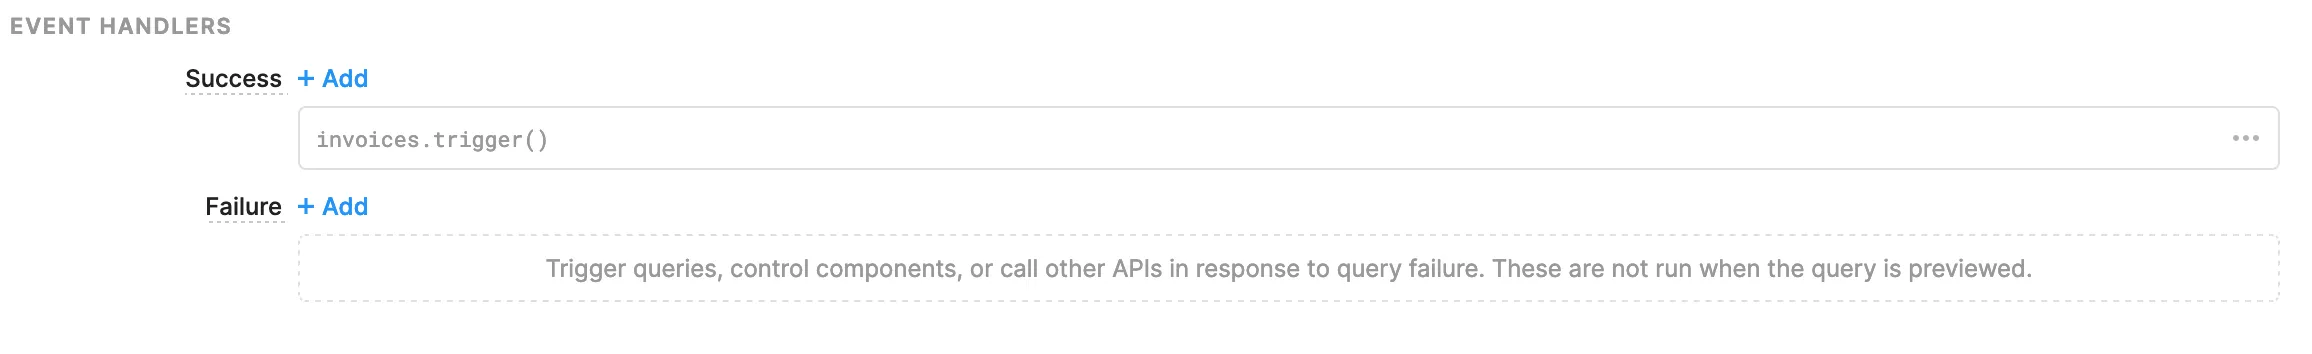
Success! But is the notion of event handlers and triggers really a “no-code” notion?
Conclusion
With the creation of a dashboard and a table view that includes a delete feature, my small admin application is now complete. It is only a subset of the react-admin e-commerce demo, but the main building blocks are there.
The main building blocks, but not the creation and edition features! That’s maybe for another post.
In my opinion, as a JavaScript developer, this no-code tool has left me with mixed feelings. While it may be well-suited for building simple applications, more complex or customized projects will require the use of JS code. At the start of my experiment, I did not anticipate the need to write Javascript for nearly every component I had in mind.
In terms of development speed, I do not find it to be faster than using a framework such as React-Admin. This may be due to my background as a developer and my first-time use of the tool. For example, with React-Admin, the same type of table view can be created with just 3 lines of code.
Even for non-developers, I believe that it may not be enough user-friendly, as it requires a basic understanding of Javascript and how APIs work. For instance, creating a query requires knowledge of how to write a query endpoint, which may not be obvious for those without a development background.
To conclude, I think it requires the knowledge of a developer to tweak no-code tools such as ReTool enough to build moderately complex apps. And developers are more productive with low-code tools… So I wouldn’t recommend it, except for simple dashboards.

Authors
Full-stack web developer at marmelab, Thibault also manages a local currency called "Le Florain", used by dozens of French shops around Nancy to encourage local exchanges.