Demystifying Monitoring: From Basics to OpenTelemetry

During a service interruption, users will notice that the application isn’t working – the most basic level of monitoring. How long can my application remain in this state? For a seldom-visited website, downtime might not result in significant financial loss. However, for other applications, preempting this situation to ensure optimal service quality becomes crucial. This is where investing in monitoring becomes valuable.
For some of our projects, it is common for me to use monitoring visualization tools like Kibana or New Relic, without really knowing what monitoring is. So, I watched a great talk about it, given by Benoit VIGUIER at the Forum PHP 2022.
This blog explores monitoring tools, from basic awareness to advanced tracing and Application Performance Management (APM) tools. Join me as I unravel the essentials of monitoring and introduce the game-changing OpenTelemetry – an open-source project revolutionizing how we gather and manage telemetry data.
What Is Monitoring?
Monitoring is about observing and tracking whether our app is functioning and potentially identify what isn’t working. Monitoring is collecting data, it won’t fix our application if it’s malfunctioning. Monitoring won’t alert us to issues either. For example, setting an error threshold above which we receive an email or a notification is part of the alerting domain rather than the monitoring domain.
Monitoring Tools
Analytics Solutions
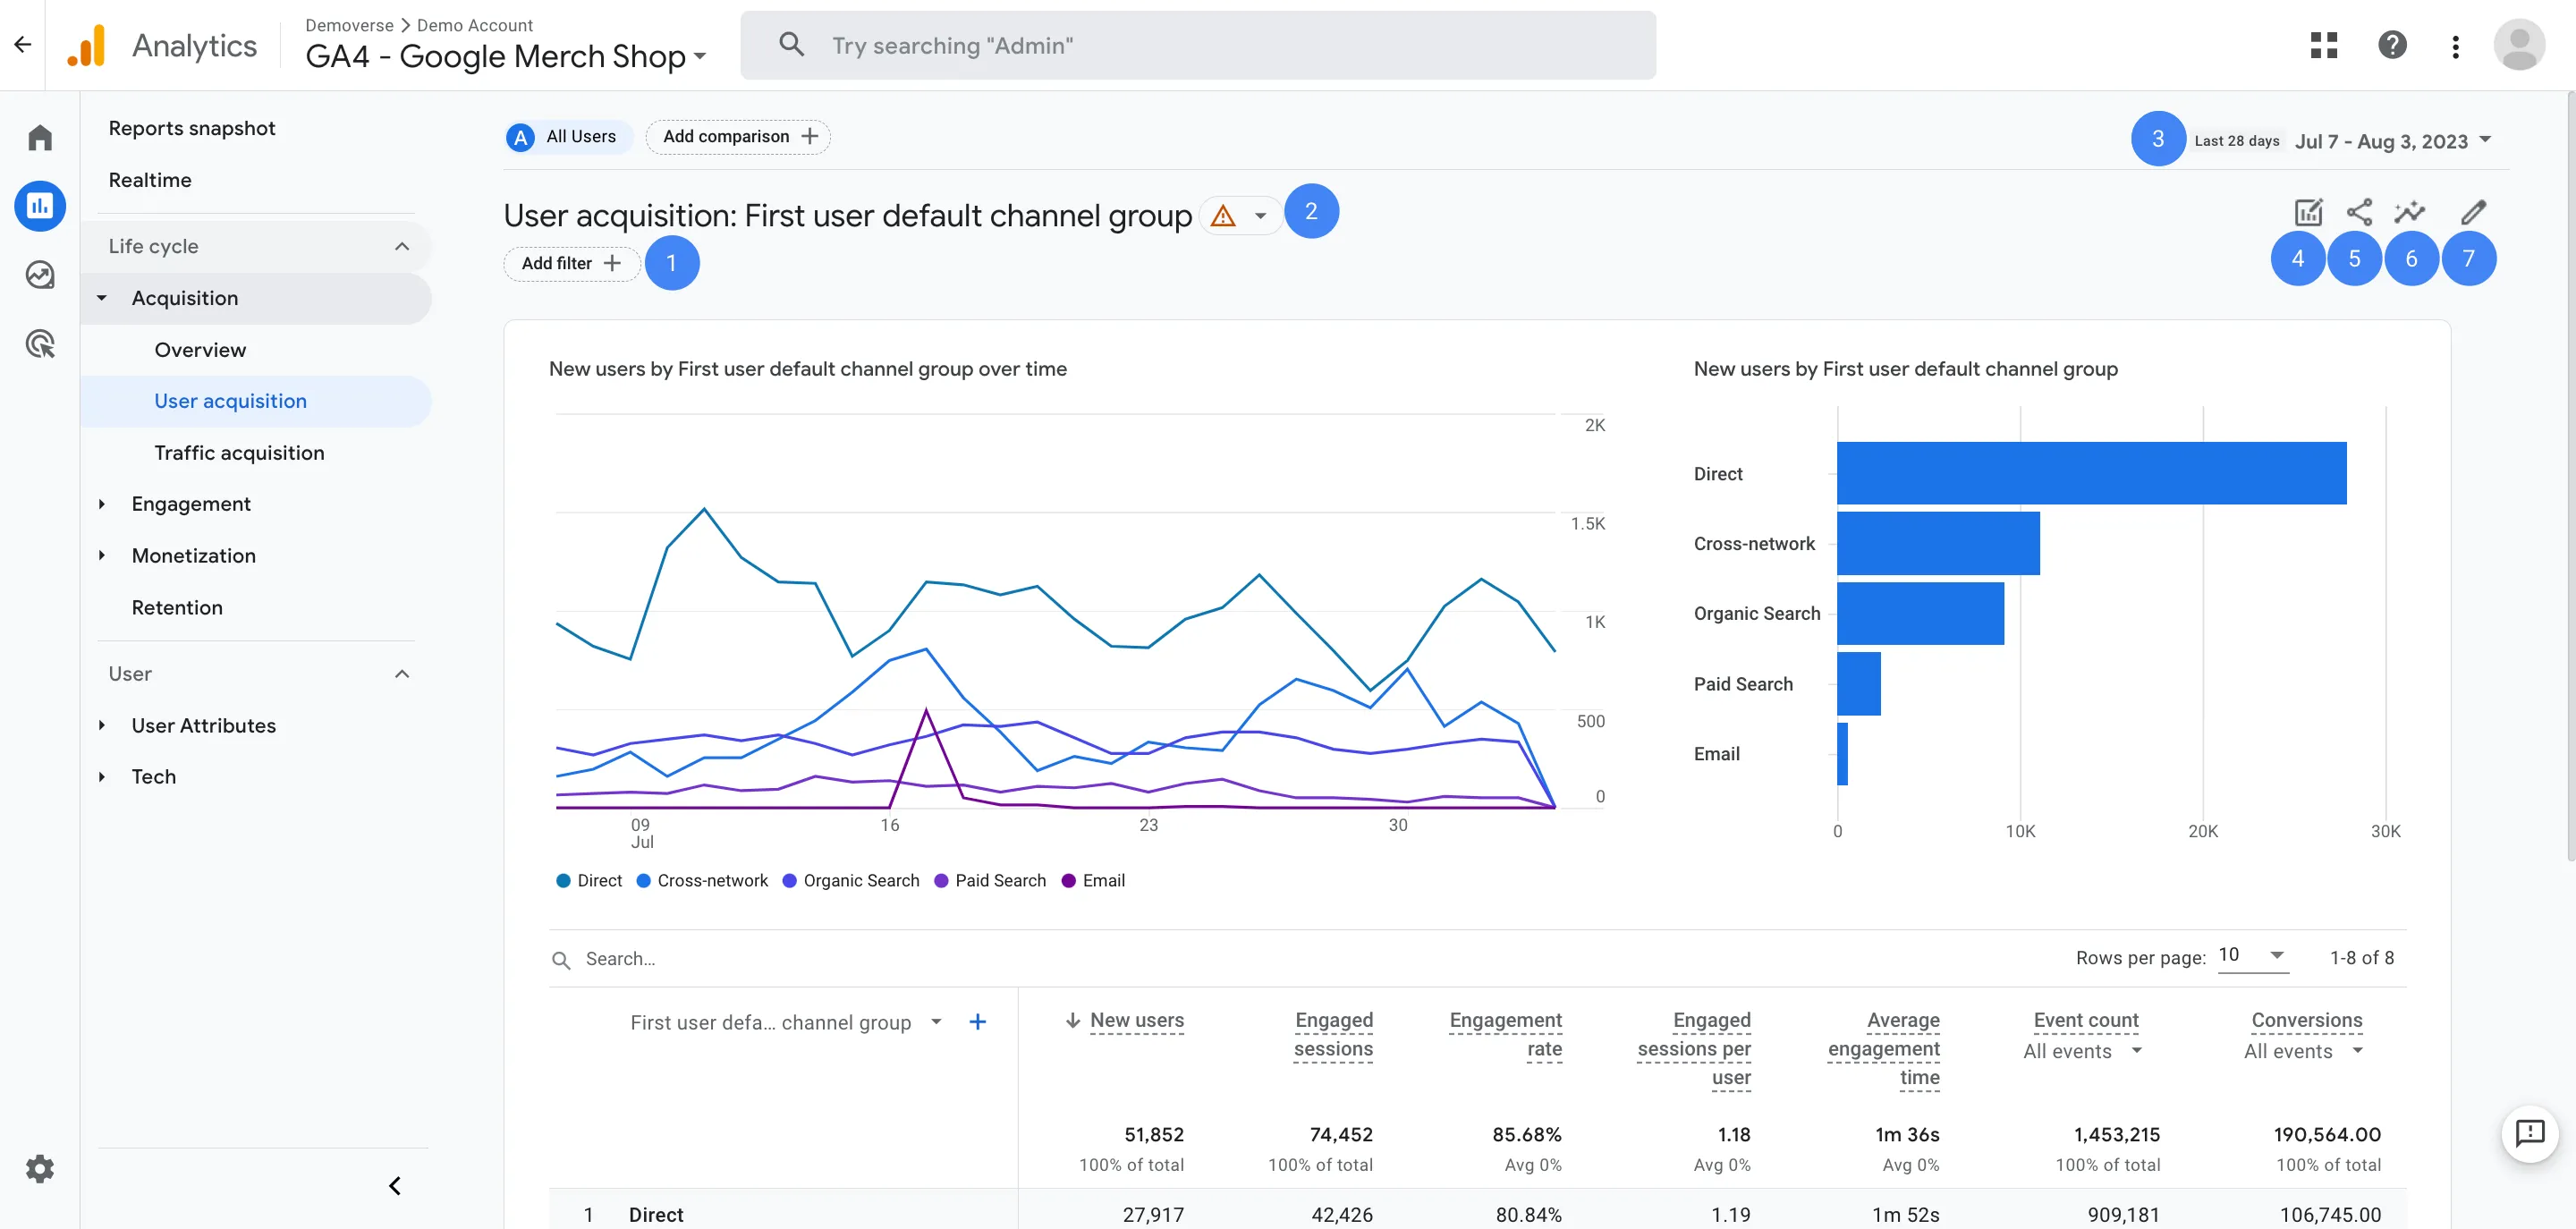
Provide business-centric insights through graphs and statistics about users visiting a website, like their profile and their search keywords for example. However, these solutions lacks technical monitoring. For example, Google Analytics focuses on user behavior but may not capture backend issues.
HTTP Probes
These probes involve sending HTTP requests to a specific endpoint or URL and examining the responses to determine the operational status of the application.
# Basic HTTP probe example using curlcurl -I https://example-website.com
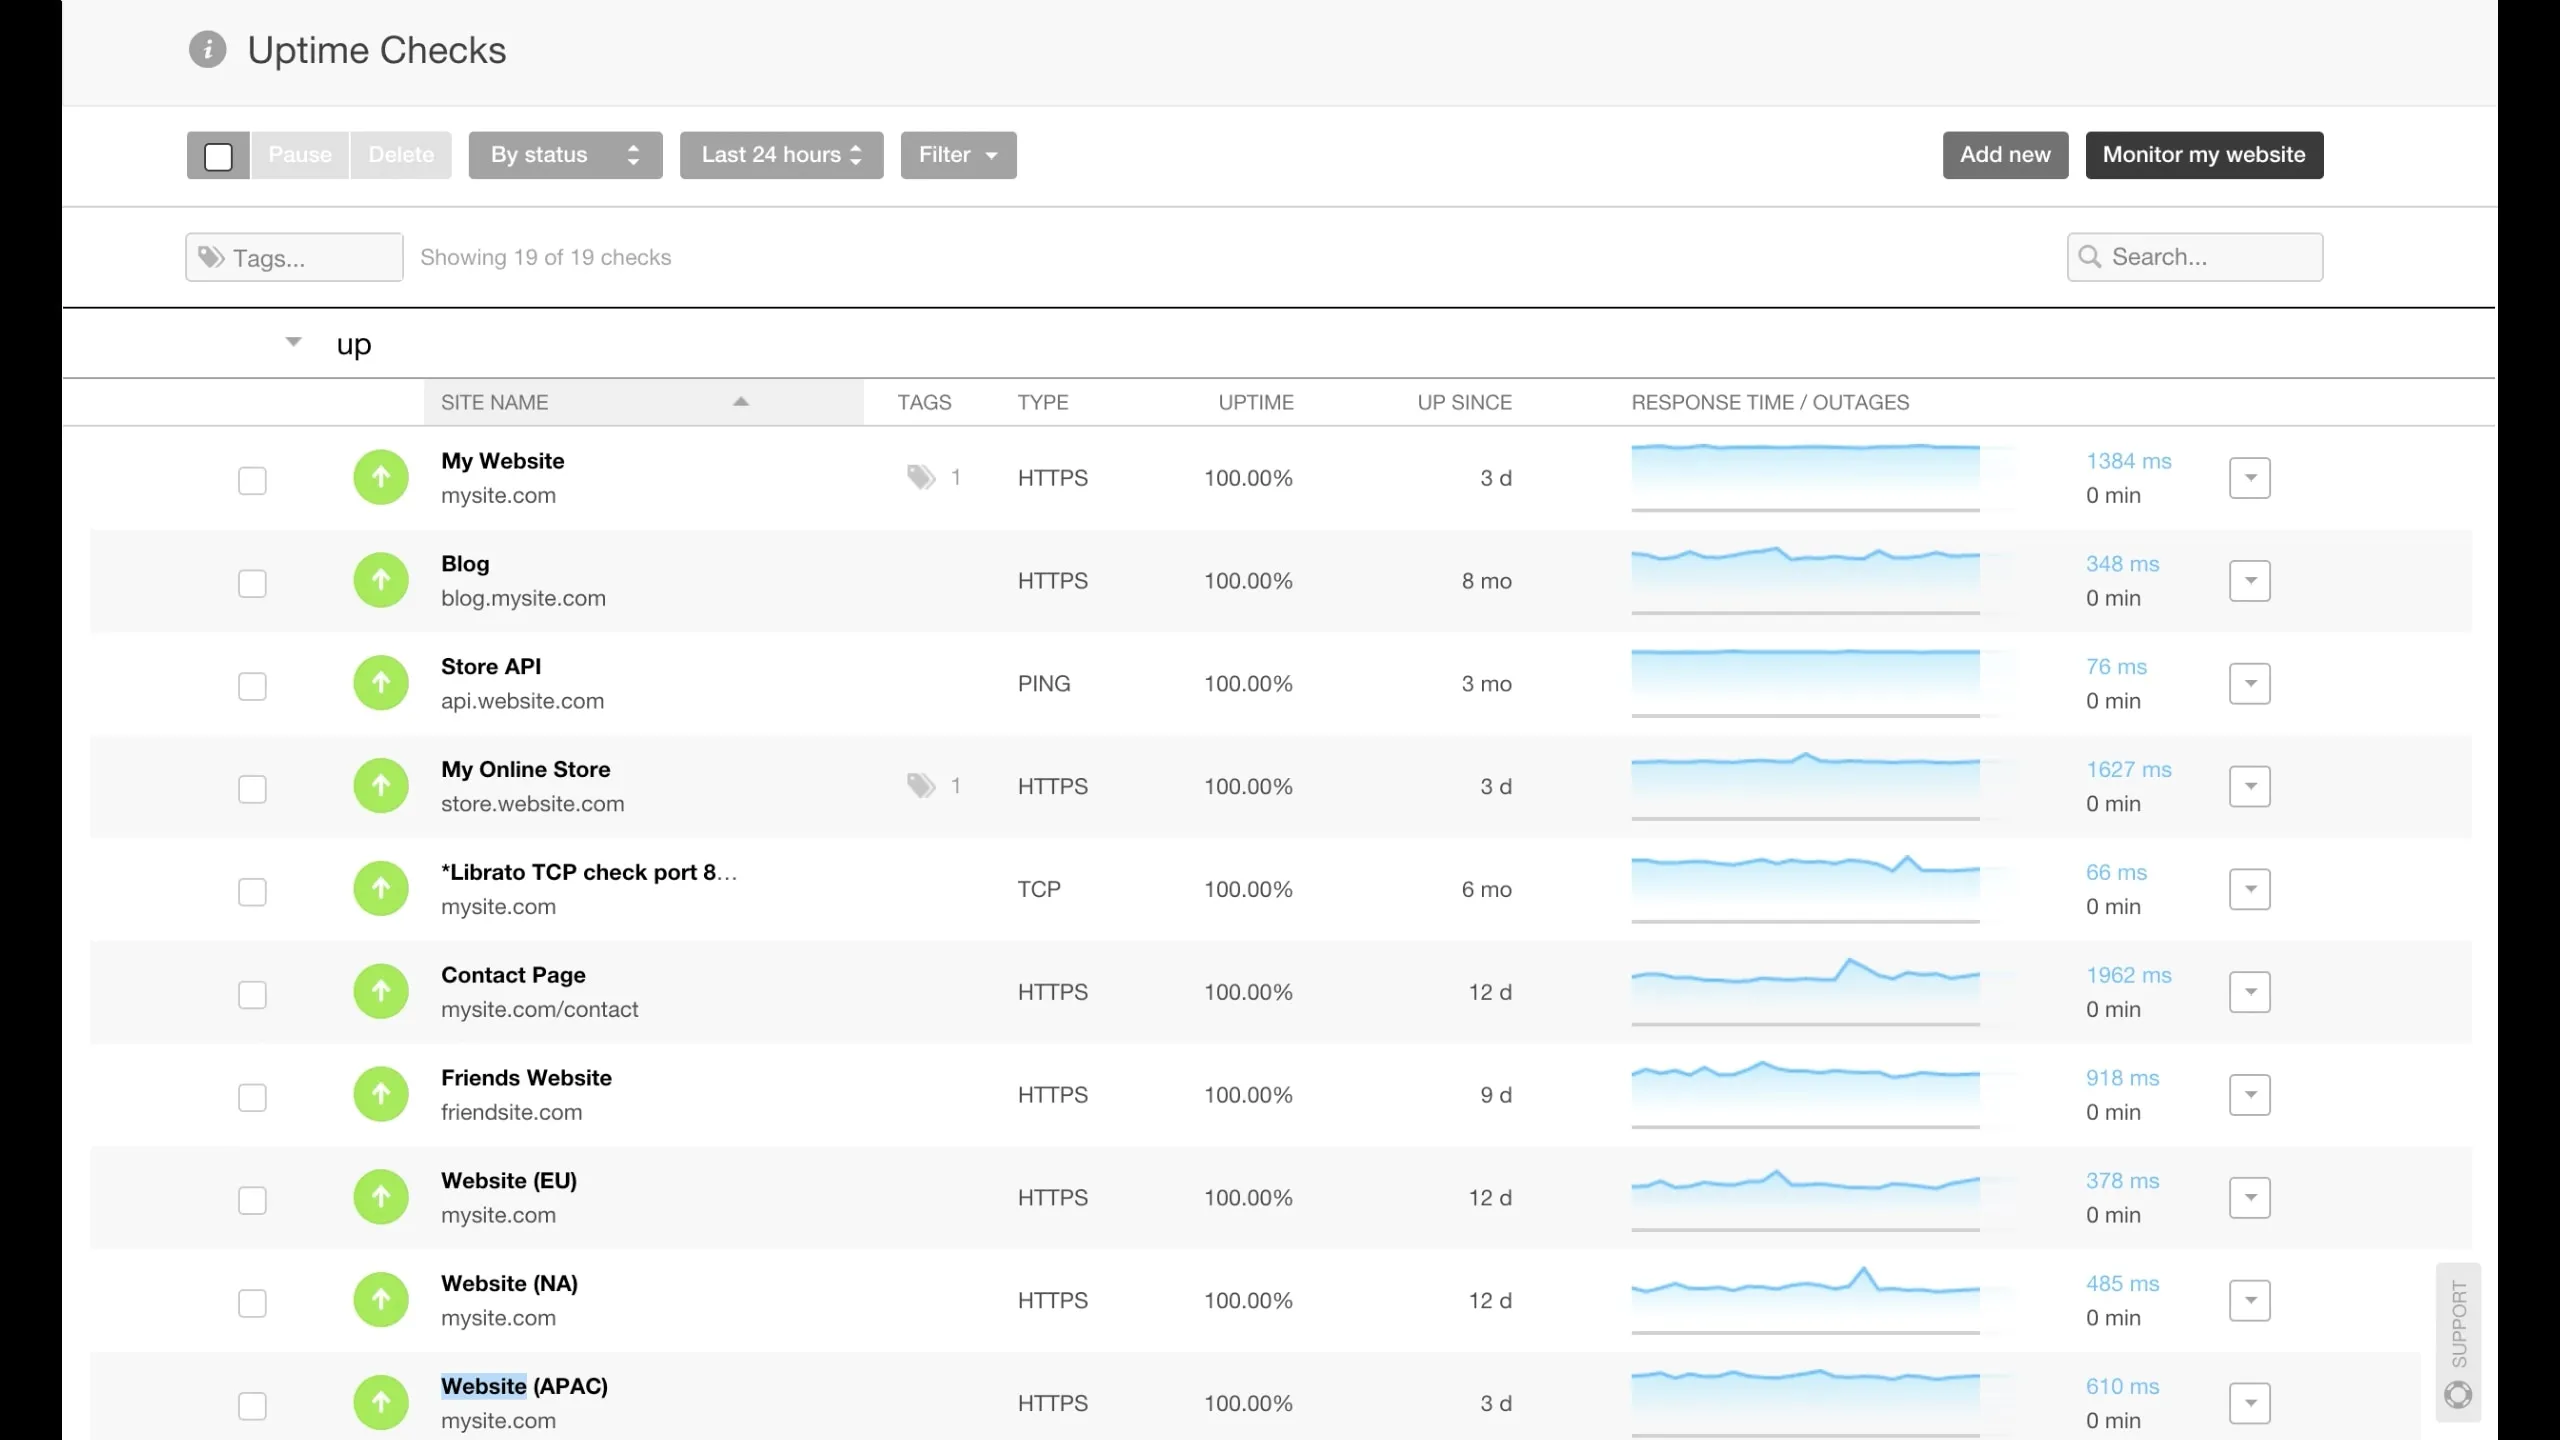
# expected responseHTTP/2 200content-type: text/html; charset=UTF-8server: nginxThis is a basic example, but you can have more complex scenarios and use tools to visualize them. For instance, Pingdom is based on HTTP probes and offers a quick overview of application health but provides limited in-depth insights.
Logs
Logs are files that list things that have happened. These are typically recorded as a list of messages in a file, often including a time stamp to record when the event occurred.
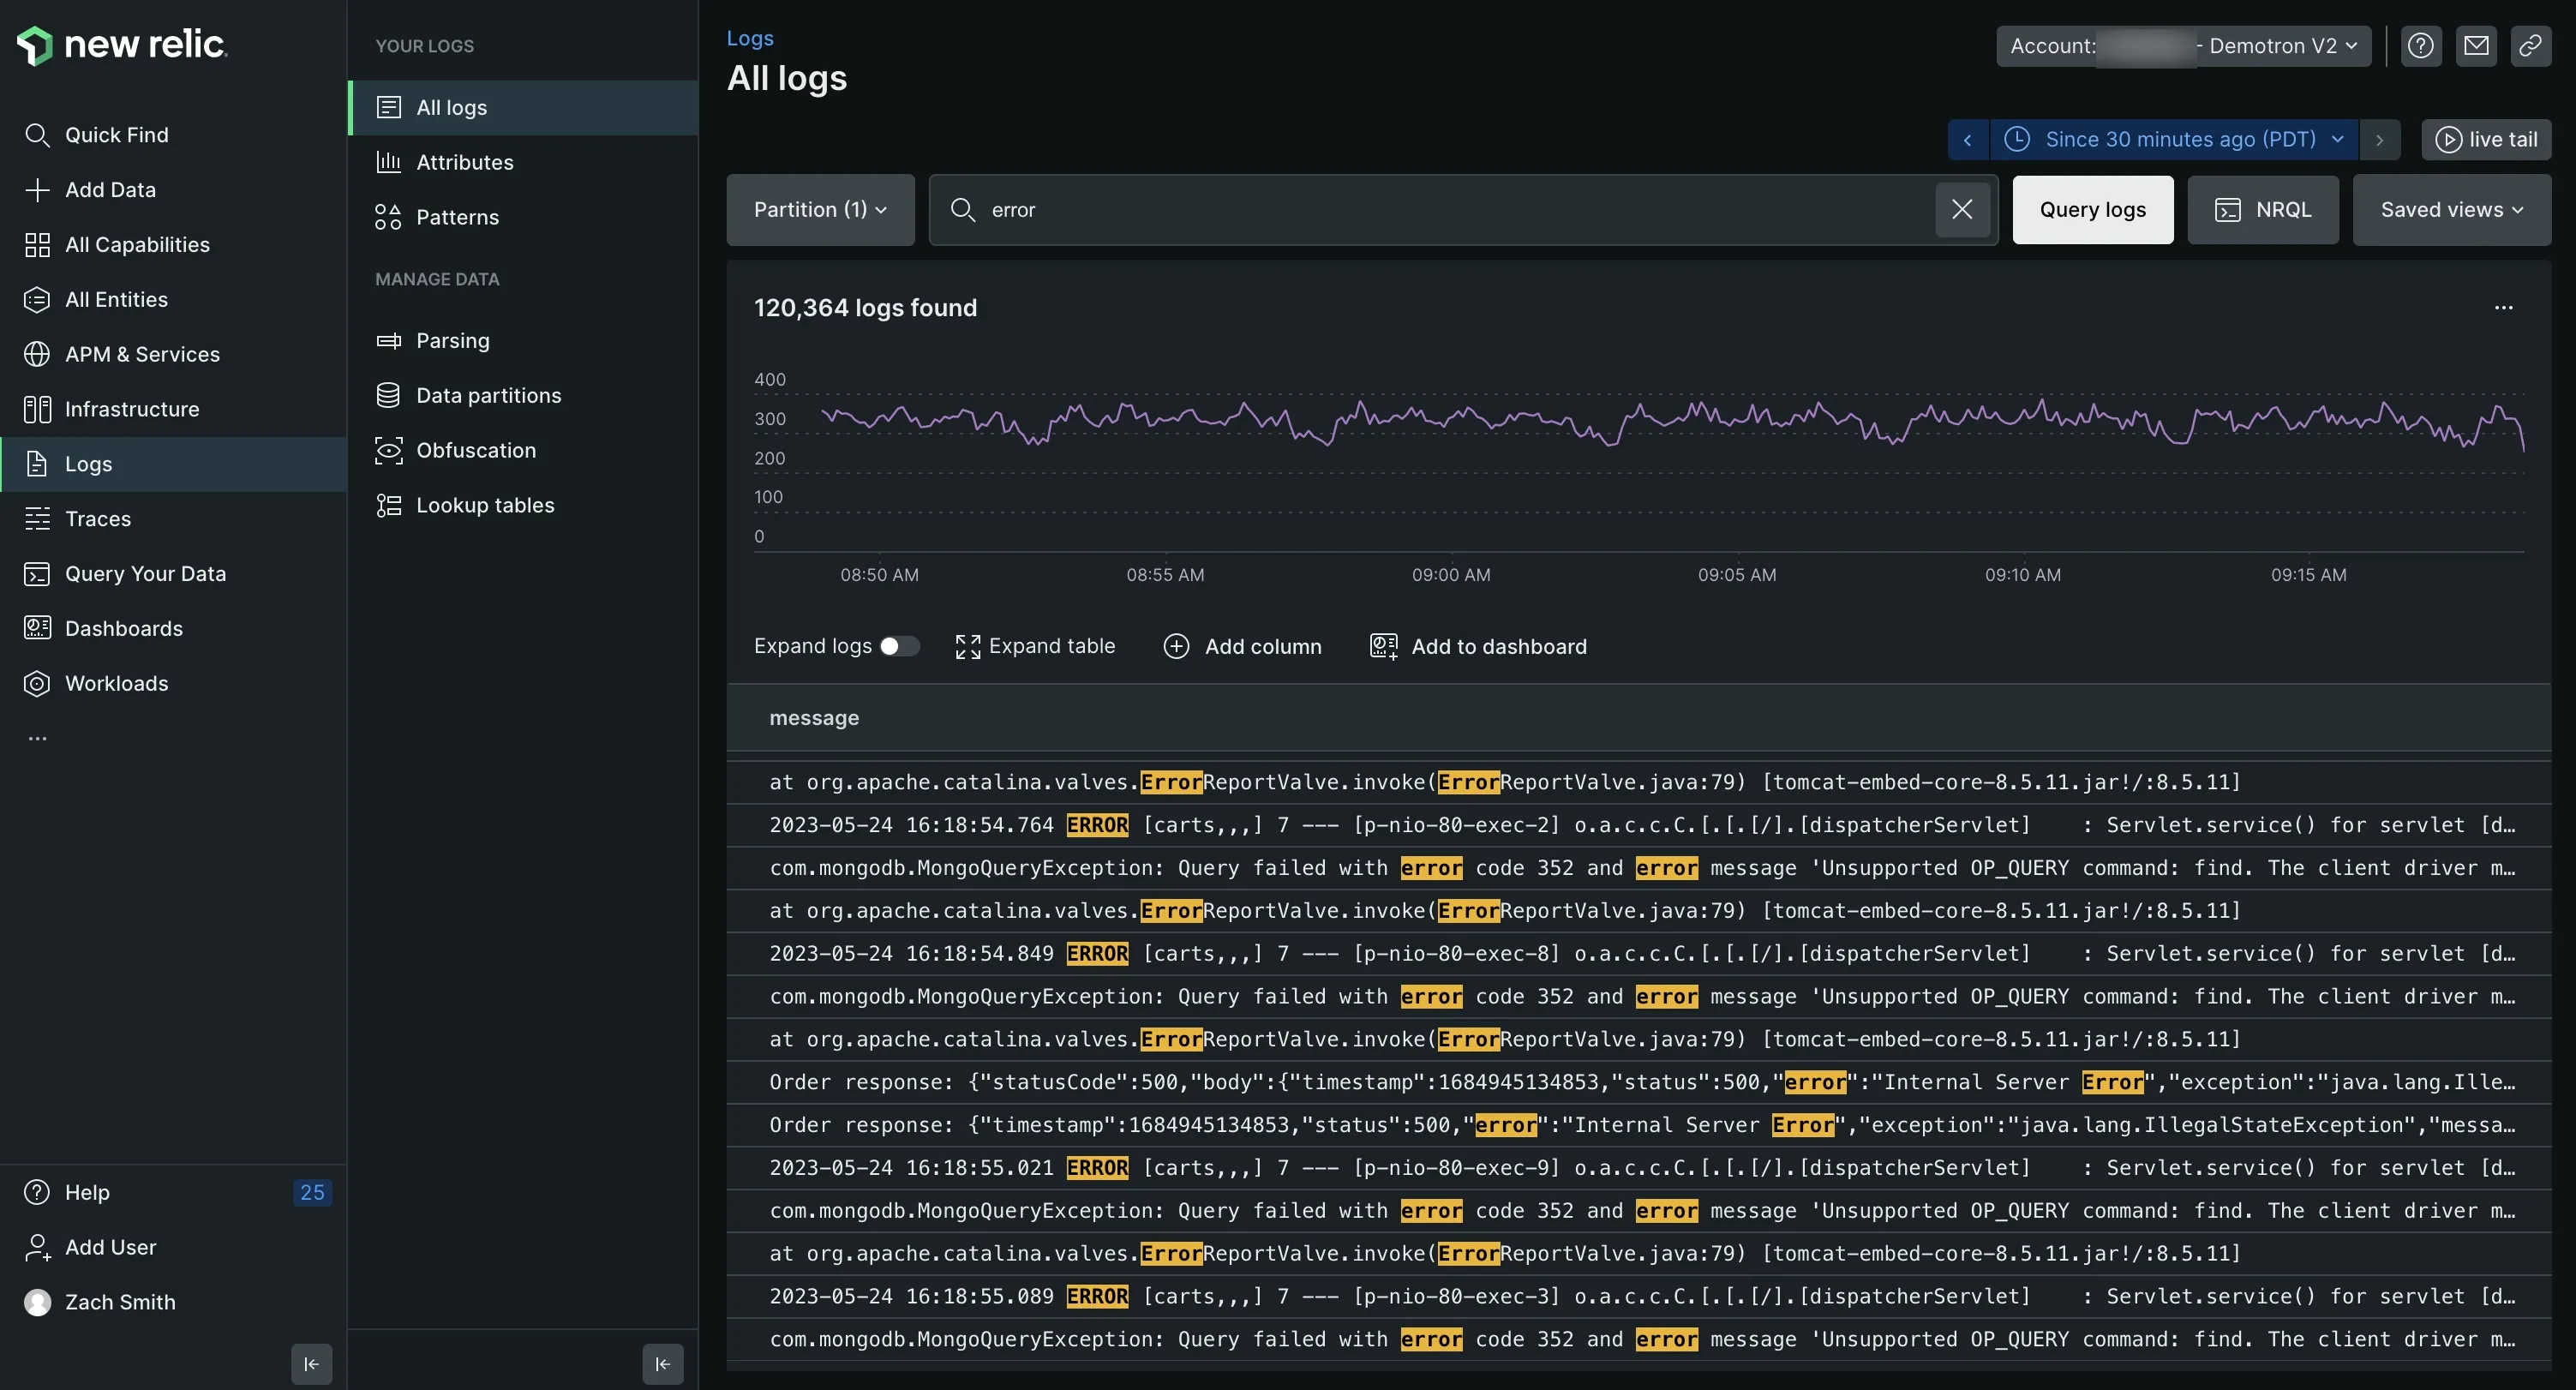
Logs offer detailed insights for debugging and issue resolution, but the abundance of information can be overwhelming. It will easily answer why it is not working but not necessarily if it is working now.
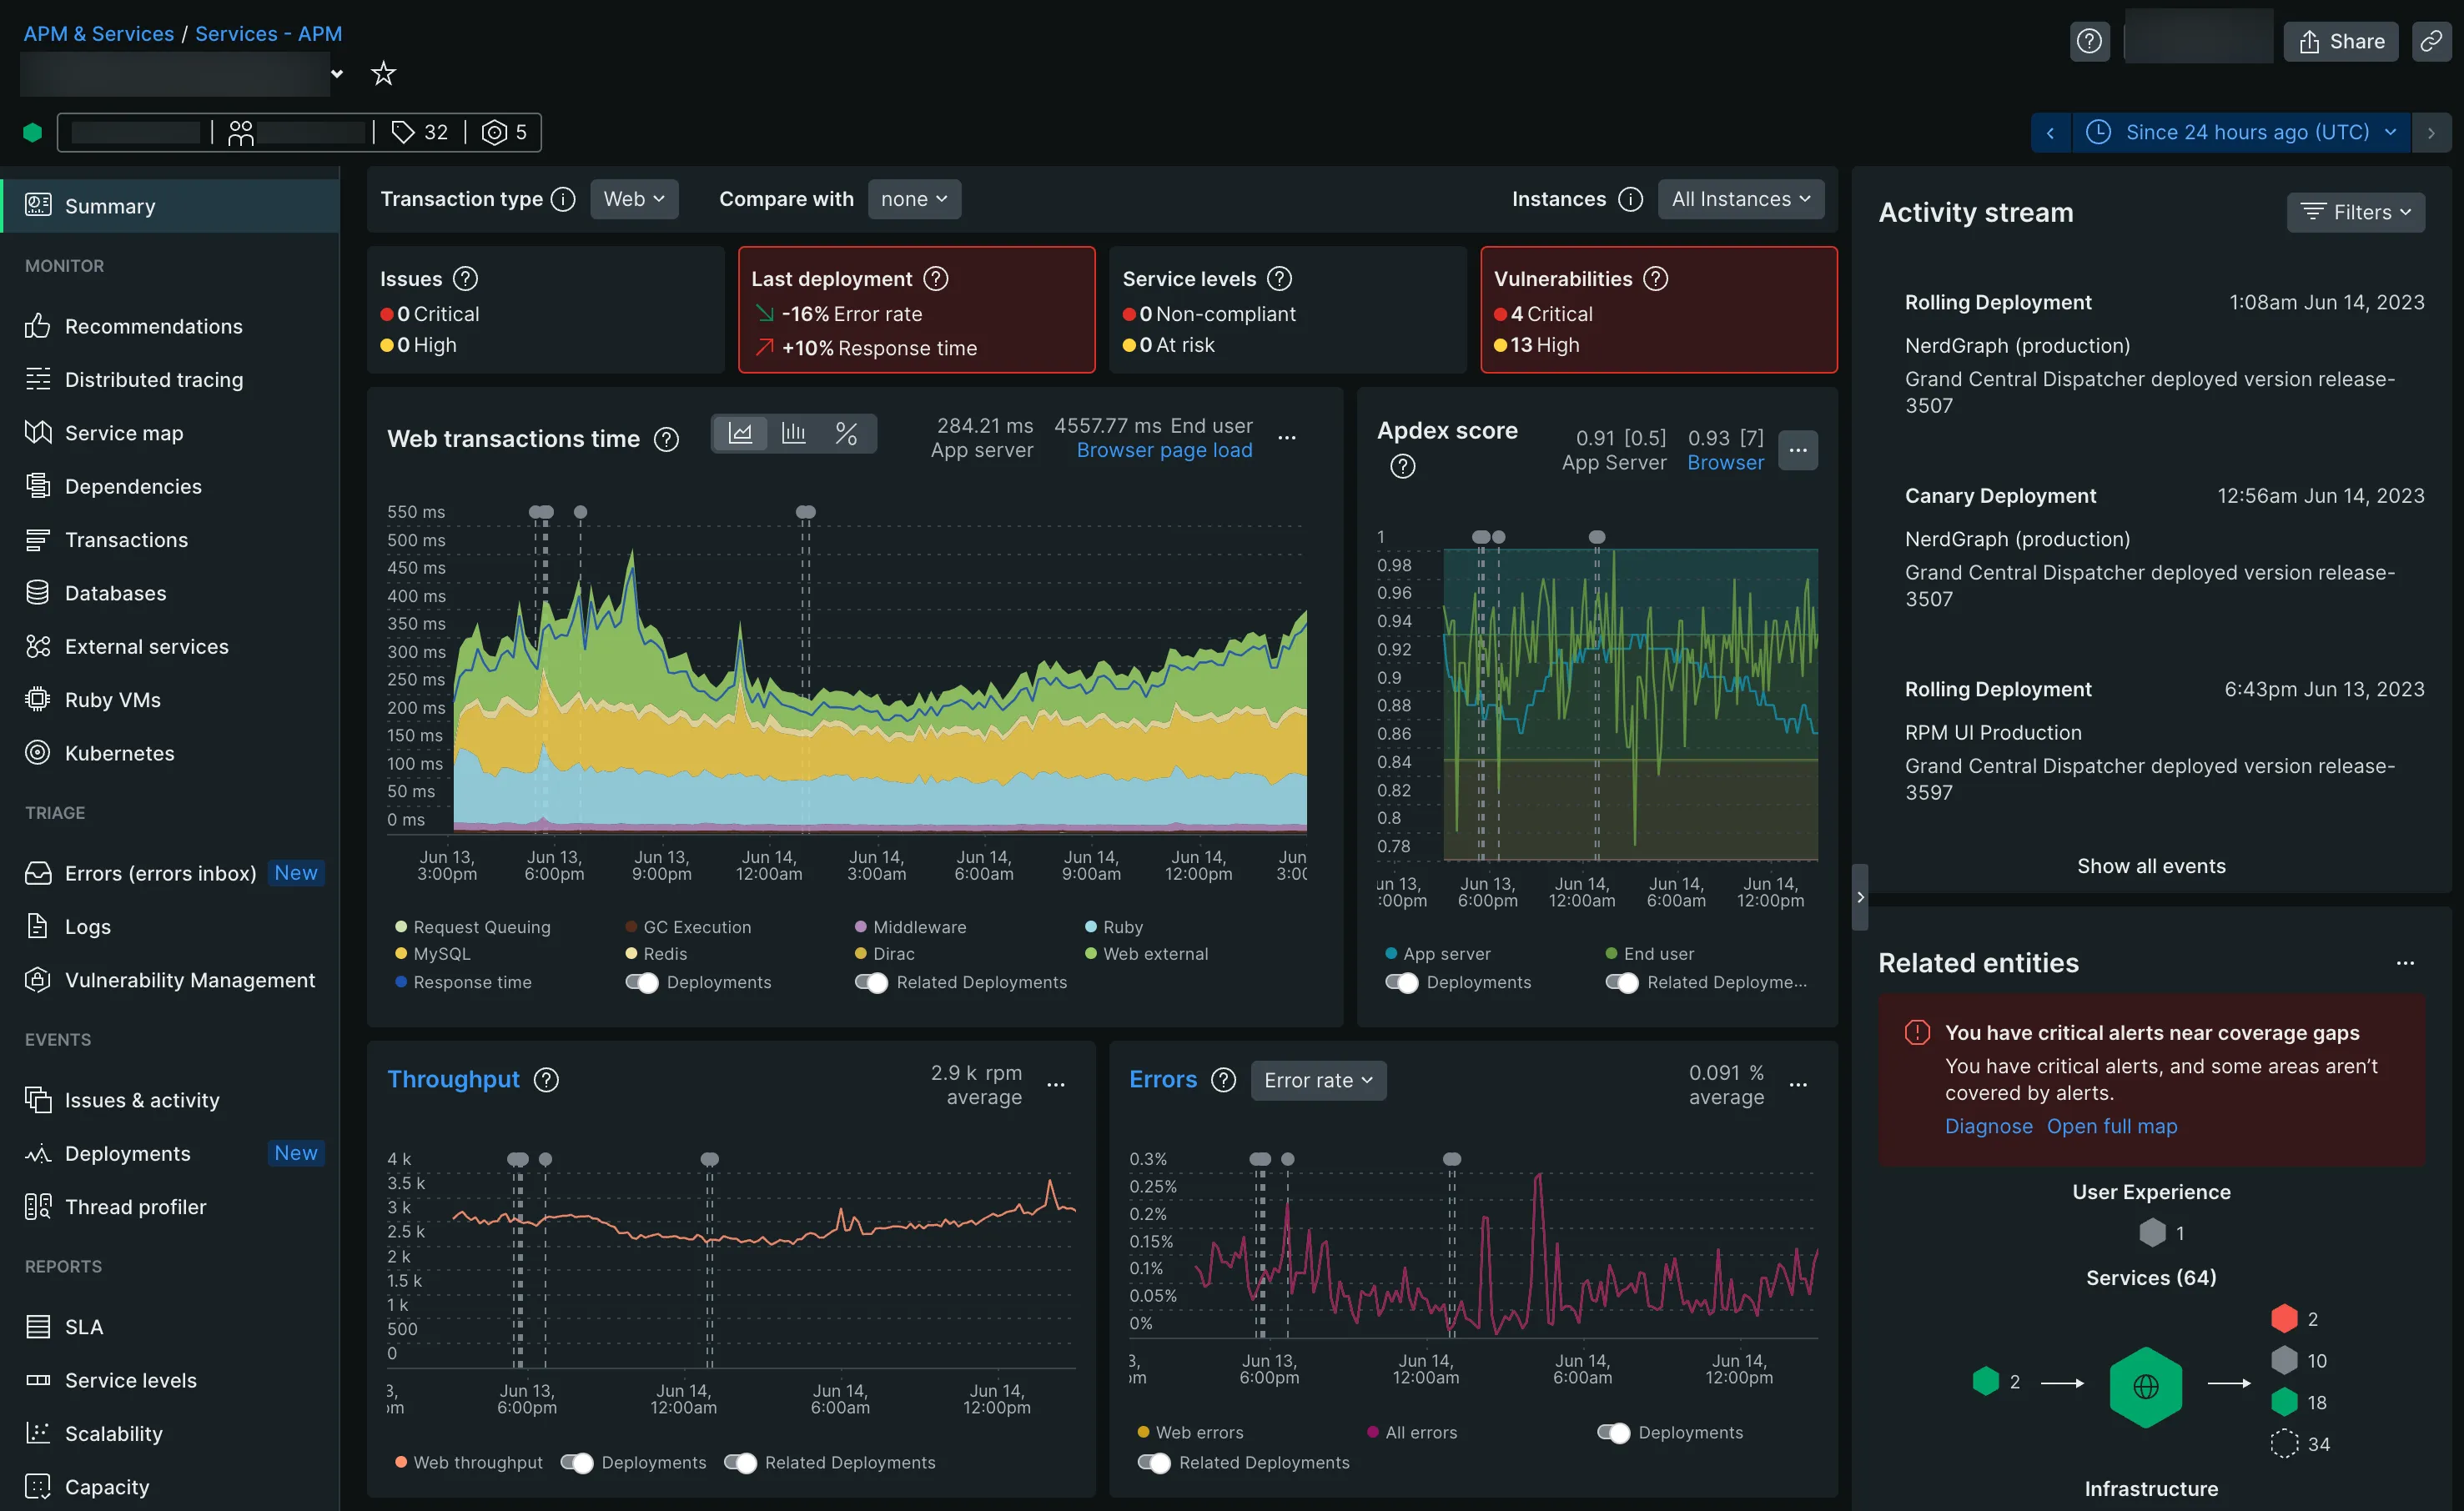
Tools like New Relic logs management can help to visualize and filter logs.
Metrics
Enable clear visualization of critical metrics but may not capture all relevant data. Metrics dashboards display easily if the software is working now but, unlike logs, will not answer why it is not working. The advantage is that metrics can easily be complemented with alerting. Metrics integration is more complicated than using logs.
There are three Golden Metrics that we should start with:
- Load by providing the number of requests per minute, for example,
- Performance, monitor how long it takes to respond
- Number of errors.
These metrics form a solid foundation but can be complemented by business metrics.
Tracing
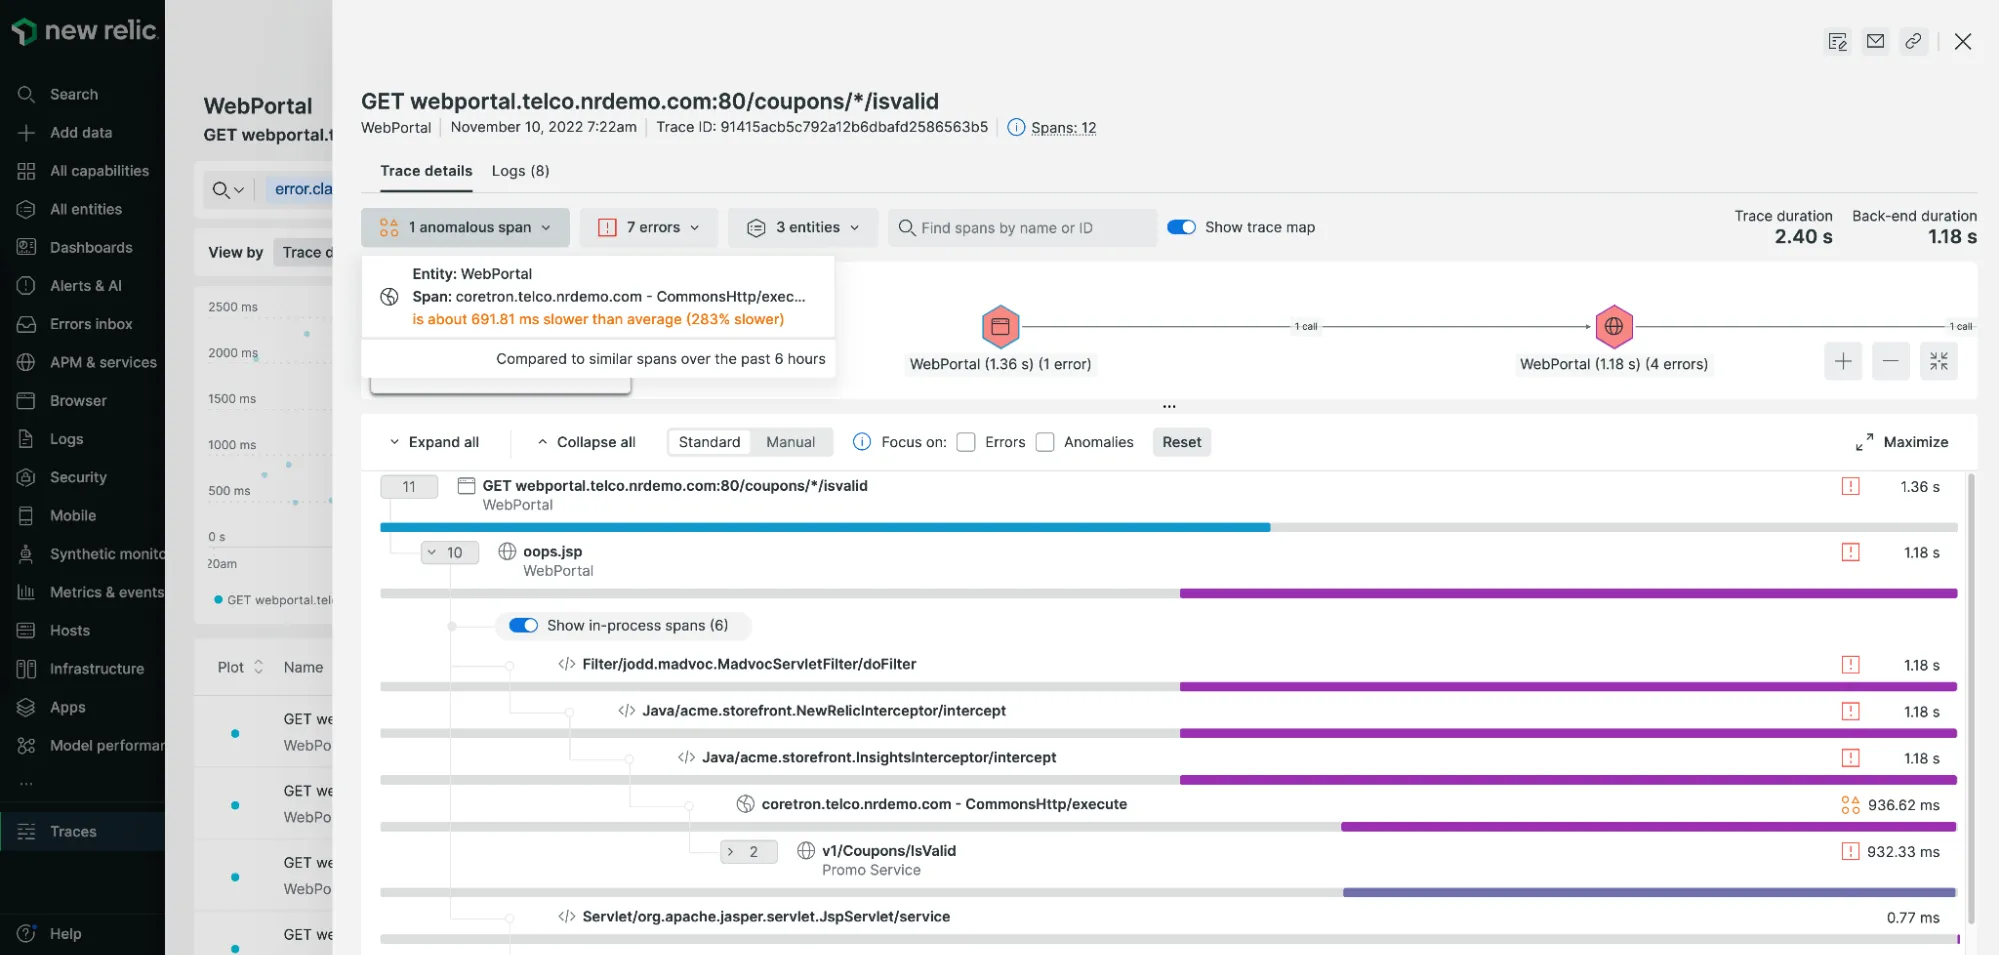
Tracing measures the entry and exit points of each request, somewhat like profiling, which looks at which function is executed in what order. Tracing refers to the process of tracking the flow of requests as they traverse through various components of a distributed system or application.
It provides a good overall view of what’s happening in the application and more detailed insights. A trace is the story of a request; it has a unique identifier, and we can associate logs with it, for example, to know which microservices were called. The downside is that it requires much more instrumentation.
Application Performance Management
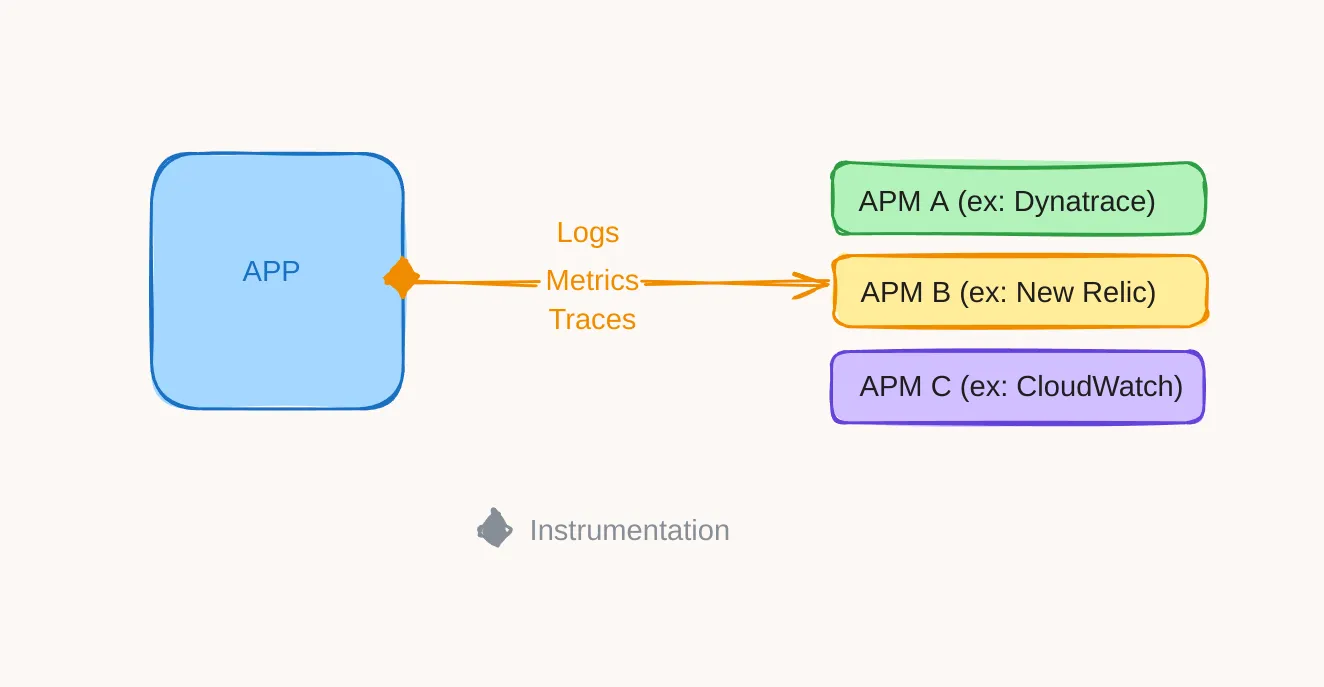
Logs, metrics, and traces collectively form the three pillars of observability within telemetry. Each of these tools can be handled by a specific service managed by specific instrumentation.

Today, there are APMs (Application Performance Management or Application Performance Monitoring) like New Relic that combine these three services with a single integration. The drawback is that this integration remains specific to the APM used, and if you want to switch APMs, you have to redo this integration.
OpenTelemetry
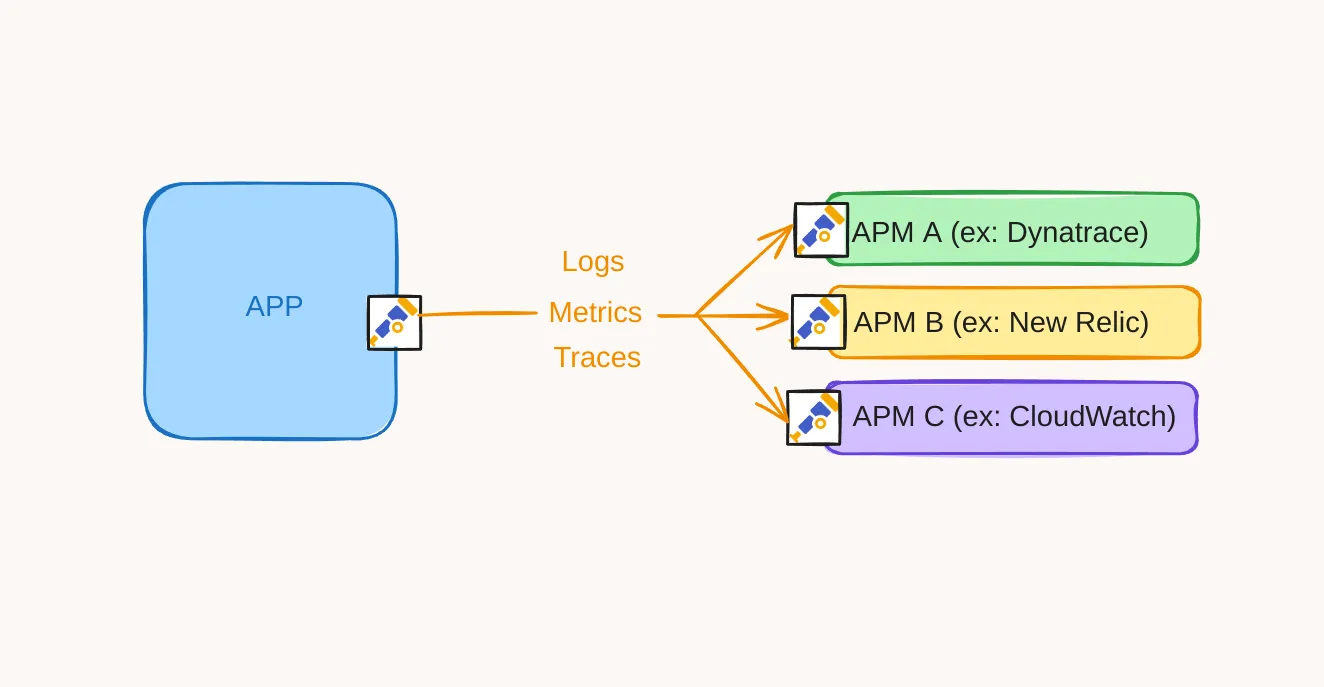
What if we could have a unified instrumentation, compatible with any APM (Application Performance Monitoring) of our choice? This is where OpenTelemetry comes into the picture.
![]()
OpenTelemetry is one of biggest open-source projects founded by the Cloud Native Computing Foundation (CNCF), in addition to Prometheus and Kubernetes. It is the combination of two overlapping open source distributed tracing projects, OpenTracing and OpenCensus, merged into a single project. It has been developed collaboratively by a community of contributors since 2019. OpenTelemetry is a protocol that standardizes the communication of telemetry data between our applications and APMs.
OpenTelemetry is focused on the generation, collection, management, and export of telemetry data and now stably covers tracing, metrics, and almost logs.
From a developer’s perspective, with a single integration, you can test different APMs.
It’s also interesting from the APM side. In fact, OpenTelemetry is not tied to a specific language and can be used by different ecosystems. APMs no longer have to maintain specific agents for each language.
From a monitoring perspective, OpenTelemetry doesn’t change anything: your APM should offer the same dashboards with OpenTelemetry as with the APM specific instrumentation. But we’ll see that in detail in a follow-up blog post.
Conclusion
As we have just seen, there are several tools available for monitoring an application, ranging from simple ones like HTTP probes to more comprehensive ones like tracing.
Logs, metrics, and traces provide a holistic view with the possibility of obtaining more details if necessary. The challenge remains in the complexity of setting up all these components. Global solutions offered by APMs require specific instrumentation for each APM and language.
The emergence of an open-source project like OpenTelemetry seems highly promising. This tool could lead to a standardization of telemetry data collection and management, regardless of the language or APM used. As for the difficulty of instrumenting OpenTelemetry, that is what we will try to explore in an upcoming blog post.
Authors
Before choosing full-stack development, Cindy was a dentist. No kidding. You can imagine that she's a fast learner.