
Load Testing Web Applications With k6


How does a web application behave under load? What’s the maximum amount of users an application can handle? To answer these questions on a particular application, we used k6, a tool that allows us to write load tests in JavaScript. In this article, we’ll dive into what we learned using k6.
Load Testing Web Applications From A Developer’s Point Of View
Load testing is a crucial part of performance testing. It aims to create a mirror of the likely load that an application will face in production. Load testing could save the day in many different ways during the entire application lifecycle:
- It could help detect performance regressions during the development process.
- It could also help simulate user traffic in non-production environments, allowing us to detect bugs we prefer to avoid finding directly in production.
- This is a great way to identify the limitations and bottlenecks of our system.
- We aim to ensure that our application meets the Service Level Indicators (SLIs).
There are a lot of open-source load testing tools. To name a few:
- Apache JMeter,
- Gatling.io,
- Locust,
- k6,
- Apache Bench.
- Siege,
- Vegeta,
- Bees with Machine Guns,
- Artillery,
K6 To The Rescue

K6 allows us to write tests in JavaScript, and as JS developers, we naturally feel comfortable with it. It is also open-source, popular (over 26k stars on GitHub), and actively maintained. Lastly, the documentation is very well written and easy to understand.
Crafted in 2016 by some individuals coming from the MMORPG world, it has been a growing success since and was acquired by Grafana in 2021. K6 does more than just load testing, as it also includes:
- Synthetic monitoring
- Server & browser performance testing
- Infrastructure testing
- Chaos and resilience testing
K6 Principles And Definitions/Scripts
From a developer’s point of view, load tests are similar to unit tests. You build a system to test, run it, and then make assertions on it.
k6 provides a complete JavaScript API to help us write load tests with minimal code. A test is a JS script with a default export that defines the test scenario. You set the conditions of the test in the options object.
For instance, a k6 test looks like this:
import http from "k6/http";
export const options = {  vus: 2, // parallel Virtual Users (VUs)  duration: "30s", // test run time};
export default function () {  const res = http.get("http://node:3000/hello-world");}
This test will simulate two virtual users requesting the /hello-world endpoint in parallel for 30 seconds. The notion of a Virtual User is important in load testing. It represents a simulated user that runs your test script continuously in a while(true) loop. All virtual users run concurrently.
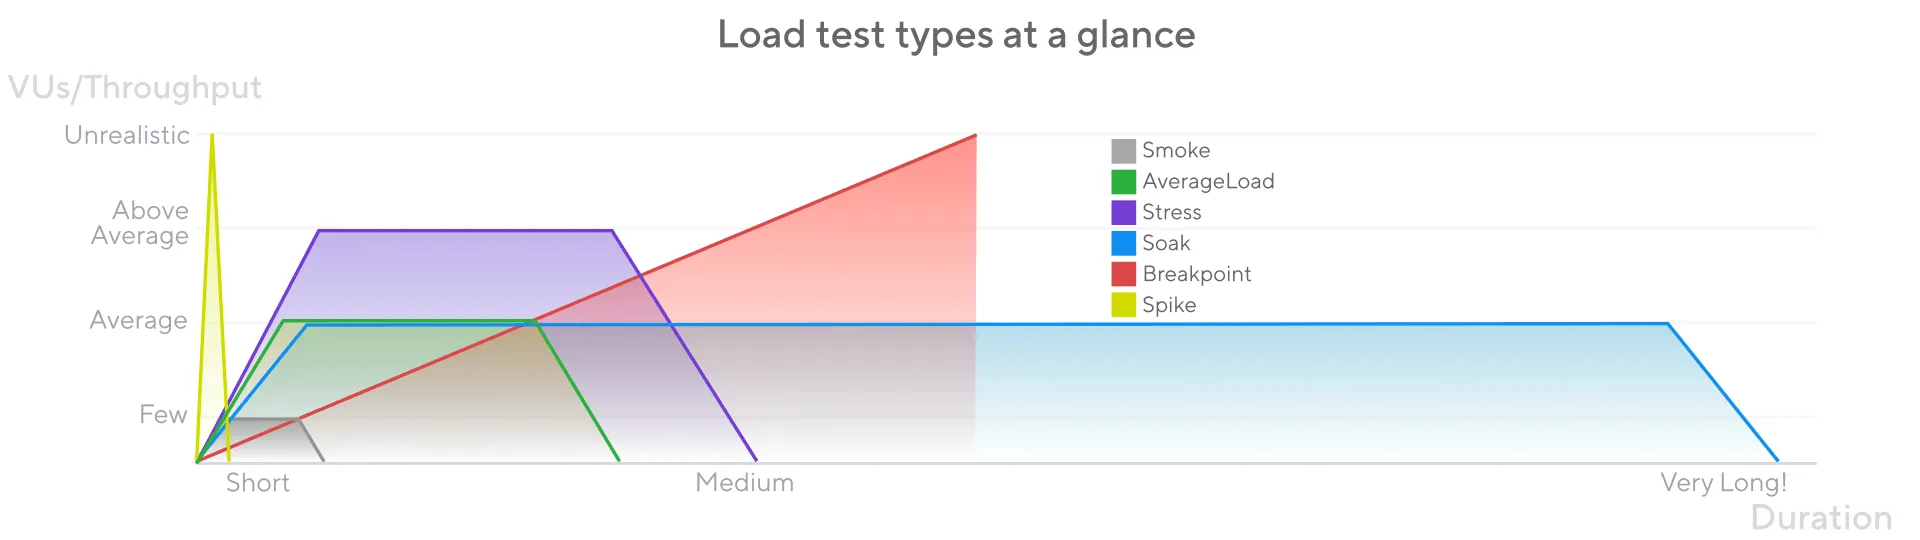
K6 supports various test types, and provides a methodology for doing load testing: start with minimal load tests, then move to higher loads and longer durations.
Let’s put this into practice!
Installing k6
To play with k6, we set up a simple Node.js app with a /posts endpoint that serves a collection of blog posts. Feel free to check out the app repository on GitHub: marmelab/load-testing.
To run k6, we used the official Docker image. Other installation methods are available for Linux, MacOS, Windows, and even a standalone binary.
As usual at Marmelab, we created a Makefile to help us run the application and the tests:
USER_ID = $(shell id -u)GROUP_ID = $(shell id -g)
export UID = $(USER_ID)export GID = $(GROUP_ID)
install:  npm install
start:  docker compose up -d --build
stop:  docker compose down
run-test:  docker run -p 5665:5665 -u=${UID} -v ${PWD}:/app -e K6_COMPATIBILITY_MODE=experimental_enhanced --net load-testing_load-test --rm -i grafana/k6 run  - tests/test.ts
Smoke Tests
The first tests we should write are Smoke tests. They aim to verify that the system works well under minimal load, which means a small number of VUs and a brief duration.
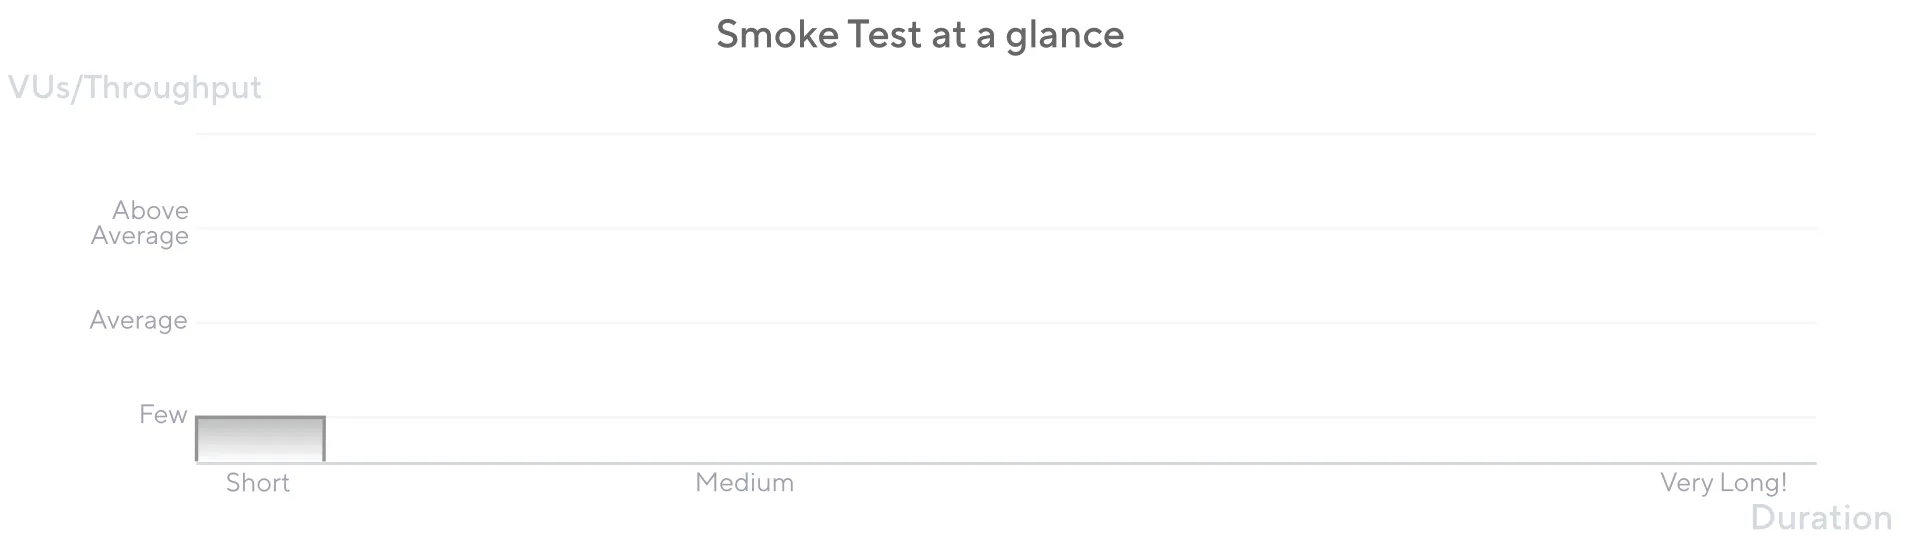
A smoke test is like a functional test that verifies that the application is up. The smoke tests should be launched when the source code changes to ensure the update does not break the endpoint.
Here is a typical smoke test:
import http from "k6/http";import { check, sleep } from "k6";
export const options = {  vus: 2,  executor: "per-vu-iterations",  iterations: 2,  maxDuration: "10s",};
export default function () {  const res = http.get("http://node:3000/posts");  check(res, { "status was 200": (r) => r.status == 200 });  sleep(1);}
Here, we tell the test to get the /posts endpoint with 2 VUs, applying the per-vu-iterations executor, which means that each VU executes an exact number of iterations. With the maxDuration option, we limit the execution to 10 seconds.
We added an assertion to check that the status is 200.
Thanks to our Makefile, we just have to run the following command to launch the test:
make run-smoke-testThe command will run the test and output the results:
    ✓ status was 200
    checks.........................: 100.00% 2 out of 2    data_received..................: 50 kB   49 kB/s    data_sent......................: 160 B   159 B/s    http_req_blocked...............: avg=797.69µs min=778.26µs med=797.69µs max=817.12µs p(90)=813.23µs p(95)=815.18µs    http_req_connecting............: avg=112.32µs min=66.55µs  med=112.32µs max=158.09µs p(90)=148.93µs p(95)=153.51µs    http_req_duration..............: avg=4.45ms   min=3.95ms   med=4.45ms   max=4.96ms   p(90)=4.86ms   p(95)=4.91ms      { expected_response:true }...: avg=4.45ms   min=3.95ms   med=4.45ms   max=4.96ms   p(90)=4.86ms   p(95)=4.91ms    http_req_failed................: 0.00%   0 out of 2    http_req_receiving.............: avg=102.98µs min=101.42µs med=102.98µs max=104.54µs p(90)=104.23µs p(95)=104.39µs    http_req_sending...............: avg=239.07µs min=210.83µs med=239.07µs max=267.3µs  p(90)=261.65µs p(95)=264.47µs    http_req_tls_handshaking.......: avg=0s       min=0s       med=0s       max=0s       p(90)=0s       p(95)=0s    http_req_waiting...............: avg=4.11ms   min=3.58ms   med=4.11ms   max=4.64ms   p(90)=4.54ms   p(95)=4.59ms    http_reqs......................: 2       1.986299/s    iteration_duration.............: avg=1s       min=1s       med=1s       max=1s       p(90)=1s       p(95)=1s    iterations.....................: 2       1.986299/s    vus............................: 2       min=2      max=2    vus_max........................: 2       min=2      max=2

running (00m01.0s), 0/2 VUs, 2 complete and 0 interrupted iterationsdefault ✓ [ 100% ] 2 VUs  00m01.0s/10m0s  2/2 shared iters
Everything seems OK: The test runs without errors, and the check always returns true.
Most of the test output consists of statistical data. If you’re not well-versed in statistics, terms like p90, p95, and p99 might seem unfamiliar. These are percentiles. For instance, the p95 value of request duration indicates that 95% of requests are completed within this time. The median is indeed the p50 value. These metrics are generally more meaningful than the mean, as they are less affected by outliers.
However, a smoke test doesn’t use enough VUs to be statistically significant. We need to run more complex tests to get a baseline of the application performance.
Average Tests
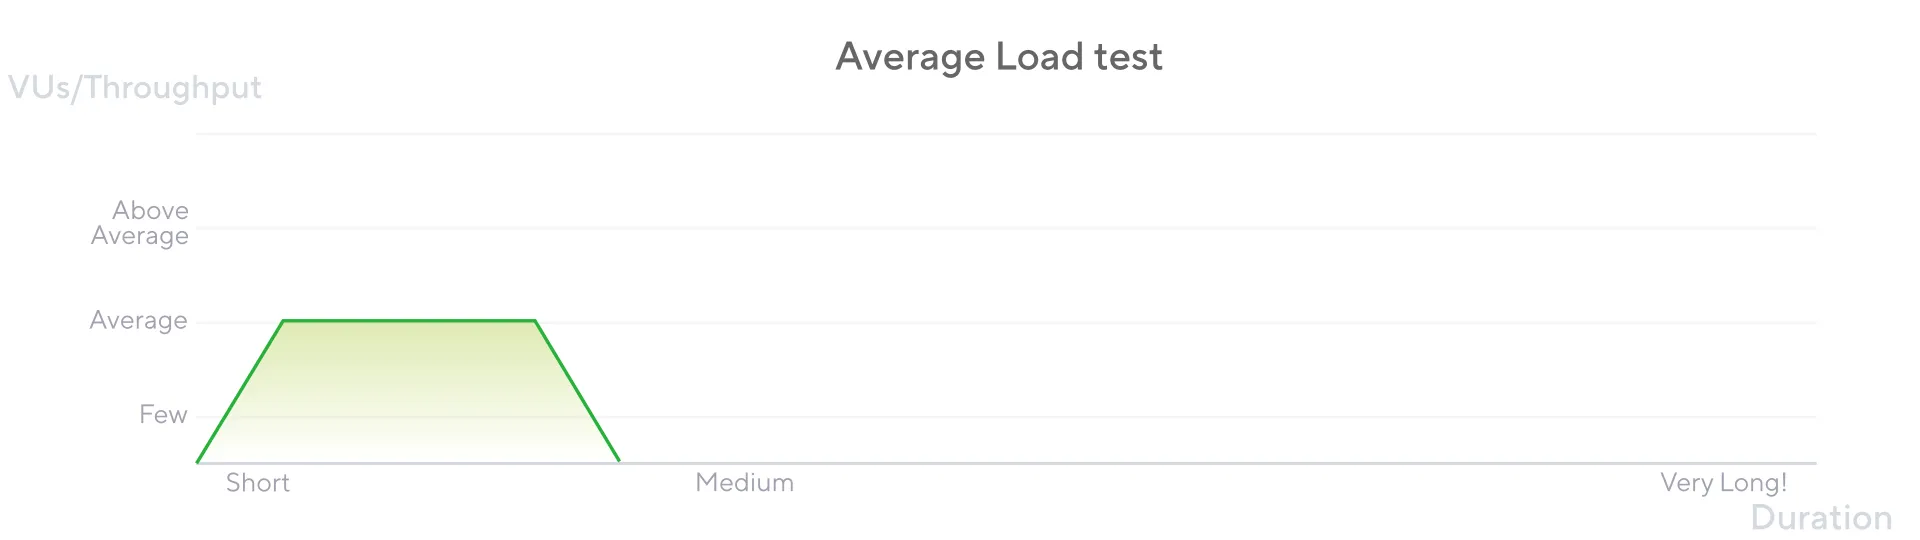
Average tests are intended to check how the app works under typical load, which means a regular production day.
An average test should run longer and with more VUs than a smoke test to match the typical traffic of your app.
import http from "k6/http";import { check, sleep } from "k6";
export const options = {  stages: [    { duration: "30s", target: 100 }, // traffic ramp-up from 1 to 100 users over 30 seconds.    { duration: "30s", target: 300 }, // ramp-up at 200 users for 30 seconds    { duration: "15s", target: 0 }, // ramp-down to 0 users  ],  thresholds: {    http_req_failed: ["rate<0.01"], // http errors should be less than 1%    http_req_duration: ["p(99)<1000"], // 99% of requests should be below 1s  },};
export default function () {  const posts = http.get(`http://node:3000/posts`);  check(posts, { "status was 200": (r) => r.status == 200 });  sleep(1);}
The stages option specifies the number of VUs to ramp up or down over a specific duration. The thresholds option sets conditions that determine if a test is successful, which is helpful for CI/CD implementation (discussed later).
The statistics of an Average test represent the ideal behavior of application performance under typical load conditions and help you define performance objectives.
You can run Average Tests after a system update to ensure the application meets performance objectives.
However, in a real-world scenario, the traffic is not constant. It’s more likely to have spikes or breaks in the traffic. To simulate these scenarios, we can use Spike and Breakpoint tests.
Spike Tests
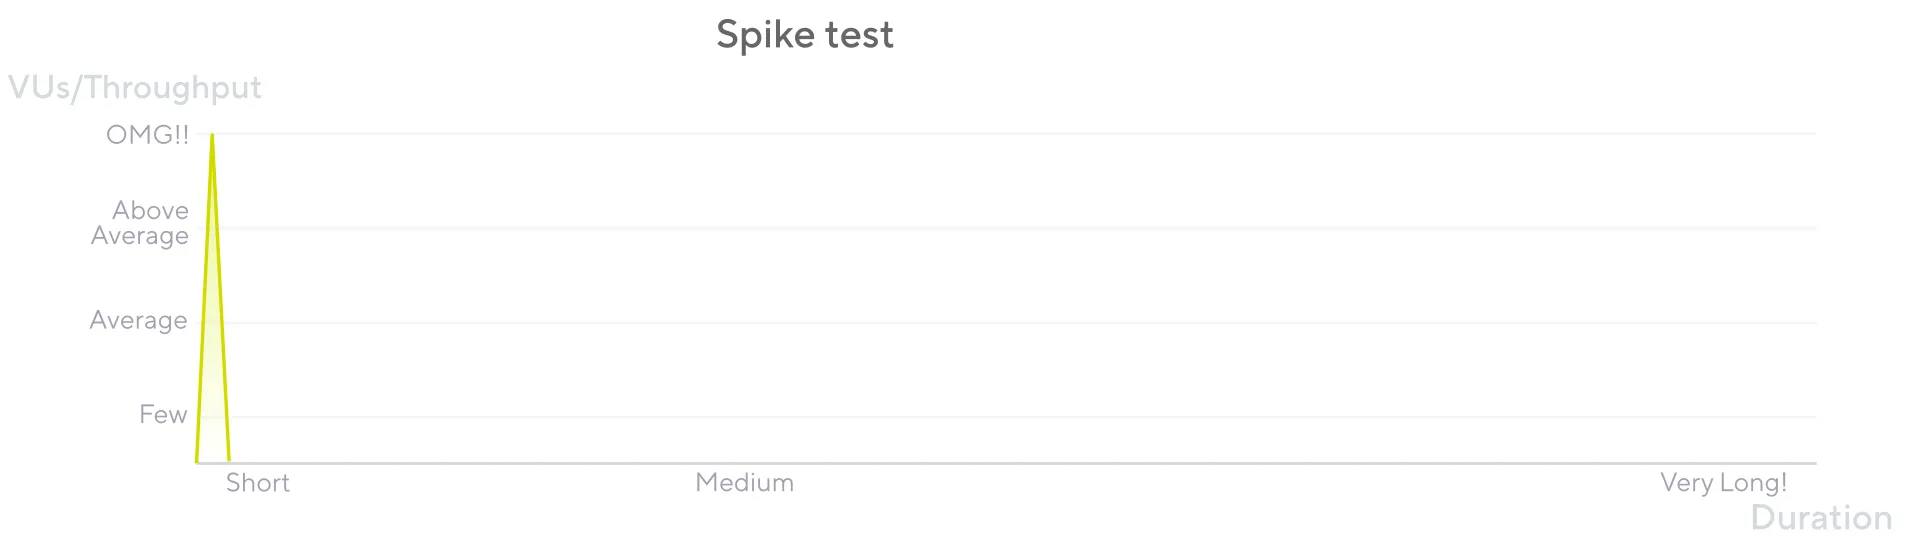
Spike testing is typically helpful for testing the application’s ability to survive sudden and massive spikes in usage.
A spike test should run for a short duration and with a high number of VUs.
import http from "k6/http";import { check, sleep } from "k6";
export const options = {  // Key configurations for spike in this section  stages: [    { duration: "30s", target: 2000 }, // fast ramp-up to a high point    // No plateau    { duration: "15s", target: 0 }, // quick ramp-down to 0 users  ],  thresholds: {    http_req_failed: ["rate<0.01"], // http errors should be less than 1%    http_req_duration: ["p(99)<1000"], // 99% of requests should be below 1s  },};
export default function () {  const posts = http.get(`http://node:3000/posts`);  check(posts, { "status was 200": (r) => r.status == 200 });  sleep(1);}
Nothing new here, except that we have significantly increased the amount of VUs to perform a spike usage.
This test should be executed when a sudden load increase is suspected. For example, when an app is about to sell tickets for a famous artist!
You need to know the projected load increase to set the correct number of VUs and duration.
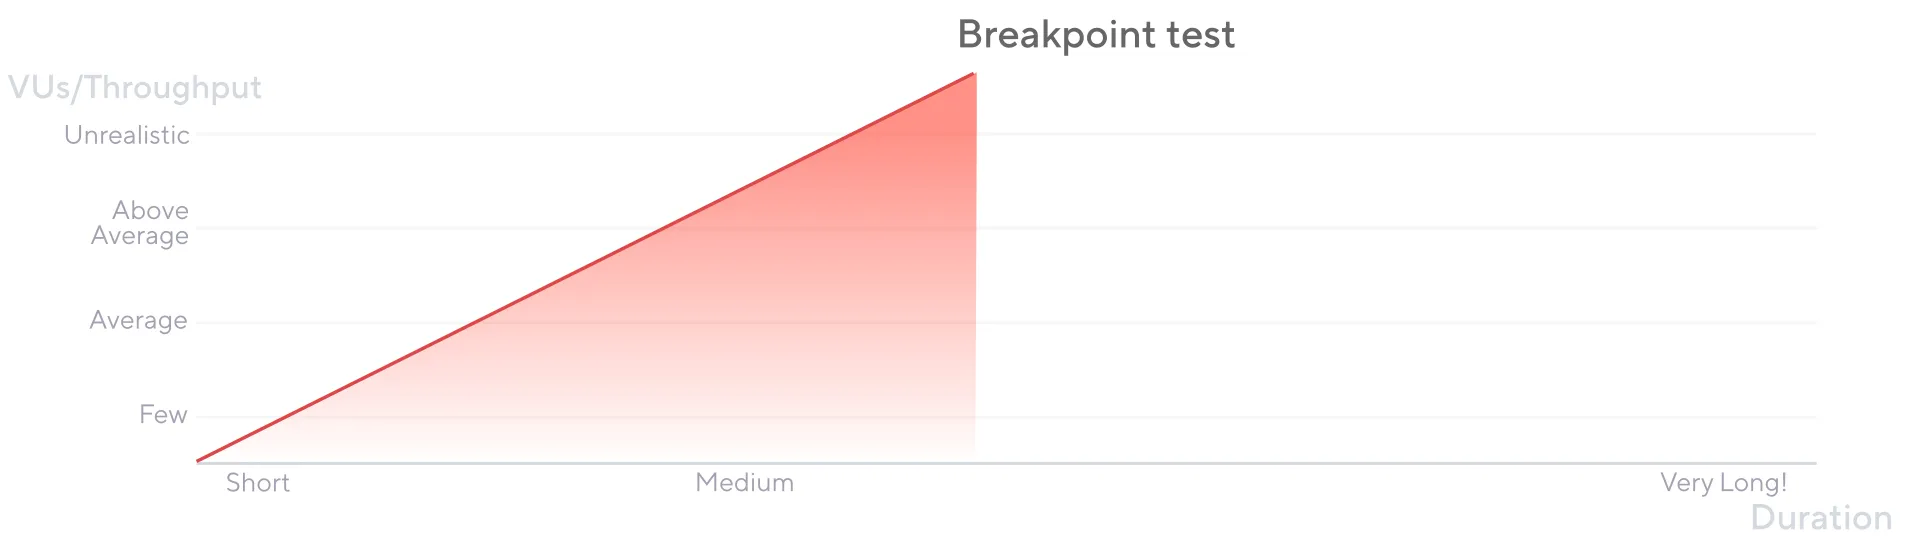
Breakpoint Tests
These tests are used to determine the maximum load that the system can handle before it breaks.
The test should be incremental in terms of VUs and duration.
import http from "k6/http";
export const options = {  discardResponseBodies: true,
  scenarios: {    breakpoint: {      executor: "ramping-arrival-rate",      startRate: 40,      timeUnit: "1m",      preAllocatedVUs: 100,      stages: [        { target: 20, duration: "30s" },        { target: 100, duration: "30s" },        { target: 10000, duration: "20s" },        { target: 20, duration: "10s" },      ],    },  },};
export default function () {  http.get("http://node:3000/posts");}
Breakpoint tests help you plan capacity: if you know how many users your system can handle, you can determine how many copies of the system you need to support the expected traffic.
You should run breakpoint tests to identify the system weaknesses and then tune the system limits and configurations to prevent the system from breaking. Understanding a system’s failure points and limits helps prepare for such scenarios.
Analysis Of Test Execution Results
k6 offers multiple visualization frontends to see (and customize) your test results.
We’ve already seen the console output with the test results. However, k6 also provides a web dashboard to visualize the results in real-time.
To enable it, we have to pass the --out web-dashboard parameter to the command used to start the script:
docker run -p 5665:5665 -u=${UID} -v ${PWD}:/app -e K6_COMPATIBILITY_MODE=experimental_enhanced --net load-testing_load-test --rm -i grafana/k6 run --out web-dashboard - <tests/average-test.tsWe can then access it on localhost:5665/ui/. It can give us fast feedback about how the application behaves.
The web dashboard includes everything we need to monitor the first three metrics of the “four golden signals”, which consist of:
- latency: the time required to obtain a response (both valid and erroneous)
- traffic: the request rates
- errors: the error rate
- saturation: how much the most limiting system resources are used
Integration In CI/Github
Now that we can emulate different traffic patterns, we can start running some of them in the CI. For example, running the Average load test after each pull request might be interesting so we can detect performance regressions during development.
Grafana offers its own GitHub workflow to execute load tests in the CI and upload the results in the Grafana cloud. Leveraging our makefile commands, we can also write our own GitHub action for that:
on:  pull_request: ~ # execute this in each pull request  push: # execute this on each push on main branch    branches:      - main
jobs:  protocol:    runs-on: ubuntu-latest    steps:      - name: "Checkout Project"        uses: actions/checkout@v3        with:          ref: ${{ github.event.pull_request.head.sha }}      - name: "Install Dependencies"        run: |          make install      - name: "Start server"        run: |          make start      - name: "Start average tests"        run: |          make run-average-test
When a developer opens a PR that degrades performance, the test should fail.
To test it, we can simulate a slow endpoint by updating the route with the following code:
app.get("/posts", async (_, res) => { setTimeout(() => { res.json(data); }, 2000);});The PR for this change doesn’t pass:
Here is the output of our test:
running (1m17.0s), 001/200 VUs, 2599 complete and 0 interrupted iterationsdefault ↓ [ 100% ] 020/200 VUs  1m15s
✗ http_req_duration..............: avg=2s      min=1.99s   med=2s      max=2s       p(90)=2s      p(95)=2s  { expected_response:true }...: avg=2s      min=1.99s   med=2s      max=2s       p(90)=2s      p(95)=2s
running (1m17.2s), 000/200 VUs, 2600 complete and 0 interrupted iterationsdefault ✓ [ 100% ] 000/200 VUs  1m15stime="2025-01-24T16:05:44Z" level=error msg="thresholds on metrics 'http_req_duration' have been crossed"make: *** [Makefile:12: run-average-test] Error 99Error: Process completed with exit code 2.
We could improve this workflow by exporting the test result to an HTML file, allowing us to view it later. To do so, add the following environment variables to our container:
- docker run -p 5665:5665 -u=${UID} -v ${PWD}:/app -e K6_COMPATIBILITY_MODE=experimental_enhanced --net load-testing_load-test --rm -i grafana/k6 run - <tests/average-test.ts+ docker run -p 5665:5665 -u=${UID} -v ${PWD}:/app -e K6_COMPATIBILITY_MODE=experimental_enhanced --net load-testing_load-test --rm -i grafana/k6 run --out web-dashboard=export=./export/average-test-result.html - <tests/average-test.tsThen, add this step to our average-load-test.yml file:
- name: "Upload average test report" uses: actions/upload-artifact@v4 with: name: average-report path: ./export/average-test-result.html retention-days: 5If there are some tests we want to run with a different periodicity, for example, once a week or only with a manual trigger, we can play with Github action events to do it:
on:pull_request: ~ push: branches: - mainon: workflow_dispatch: ~There are many other things we can do with load test automation. To find out about the different objectives that can be achieved with it, we suggest reading the k6 documentation.
Limitations
The tests we implemented here are subject to various limitations. In fact, it’s challenging to perform load tests properly on an actual, complex infrastructure.
First, running performance tests in GitHub CI is a bad idea. The test results are highly dependent on the resources allocated by GitHub for this workflow. GitHub-hosted runners give no guarantee of network load or runner resources. A more robust way could be to self-host some dedicated runners to have a more reproducible environment.
Secondly, we need to run the test program and the System Under Test (SUT) on different machines; otherwise, running one will have a negative impact on the other, and our results will not reflect reality.
And finally, you shouldn’t run load tests in production. You don’t want to break the production application by feeding it hundreds of thousands of requests. Load tests should run in an isolated environment - ideally, a copy of the production environment to have realistic data.
Conclusion
We’re happy to have tried k6. It’s a comprehensive, easy-to-use tool that can help us in our day-to-day work. In addition, we were pleasantly surprised by the documentation, which mixes theoretical knowledge with concrete examples. It’s a good starting point for anyone who wants to get started with load testing.
However, as seen above, load testing is a complex topic. To do it well and for higher level metrics validation (for example SLI), there’s a lot more to think about, and k6 doesn’t seem to be talking too much about it.
We invite you to start your journey by browsing the k6-learn repository.
Authors
Full-stack web developer at marmelab, Adrien was previously working as an instructor in Alsace. He loves music and plays drums.
Full-stack web developer at marmelab, Arnaud is a Software Engineer with a strong environmental conscience. He brews his own beer, which is a good way to prepare for the future.