
How To Improve Postgres Performance: Our Tips and Tricks


Did you already feel helpless when watching the response time of your database increase month after month? Did you ever ask yourself why some SQL queries you wrote two years ago cause more and more errors over time? Don’t look further: you probably have a major performance issue on your database.
We had this problem in one of our customers project, too. We took concrete actions to fix it: gather data, understand and pinpoint the major issues, and fix them.
Here is what we learned on the way.
How Performance Issues Occur
Managing databases can be very difficult, especially after years of activity. The more we develop new features, the more the database activity increases. That phenomenom appears in every project, it’s quite usual, no reason to worry.
Let’s take the example of a classic web project.
In the beginning, when a project starts, we put the focus on delivering value by developing core features. That’s why we start by setting up the simplest database schema possible, and it works well.
And then, the project grows, and the database grows, too. It’s not a problem, our original choices are proven to be right… until everything collapses. It could happen after months, or even years later.
With databases, a query that ran fast with 10k entries may be super slow for 100k entries, and even slower with 1000k+ entries. There are thresholds changing how the database perform queries, for instance when the size of two concurrent indices changes, or when the CPU consumed by the database goes over 70% for several minutes, or when an index can’t fix in memory due to the size of the data set. If you don’t pay attention, your database might run out of CPU or spend its time waiting for I/O.
Obviously, we better identify the issues right now instead of waiting for everything to break. It will save coffee and many hours of sleep.
Monitor your Database
The first thing that should come to your mind when hearing about performances is monitoring. Like for most servers, it’s possible to monitor almost everything in your database. The priority is to watch the CPU, but you could also pay attention to the number of connections, or to the free disk space.
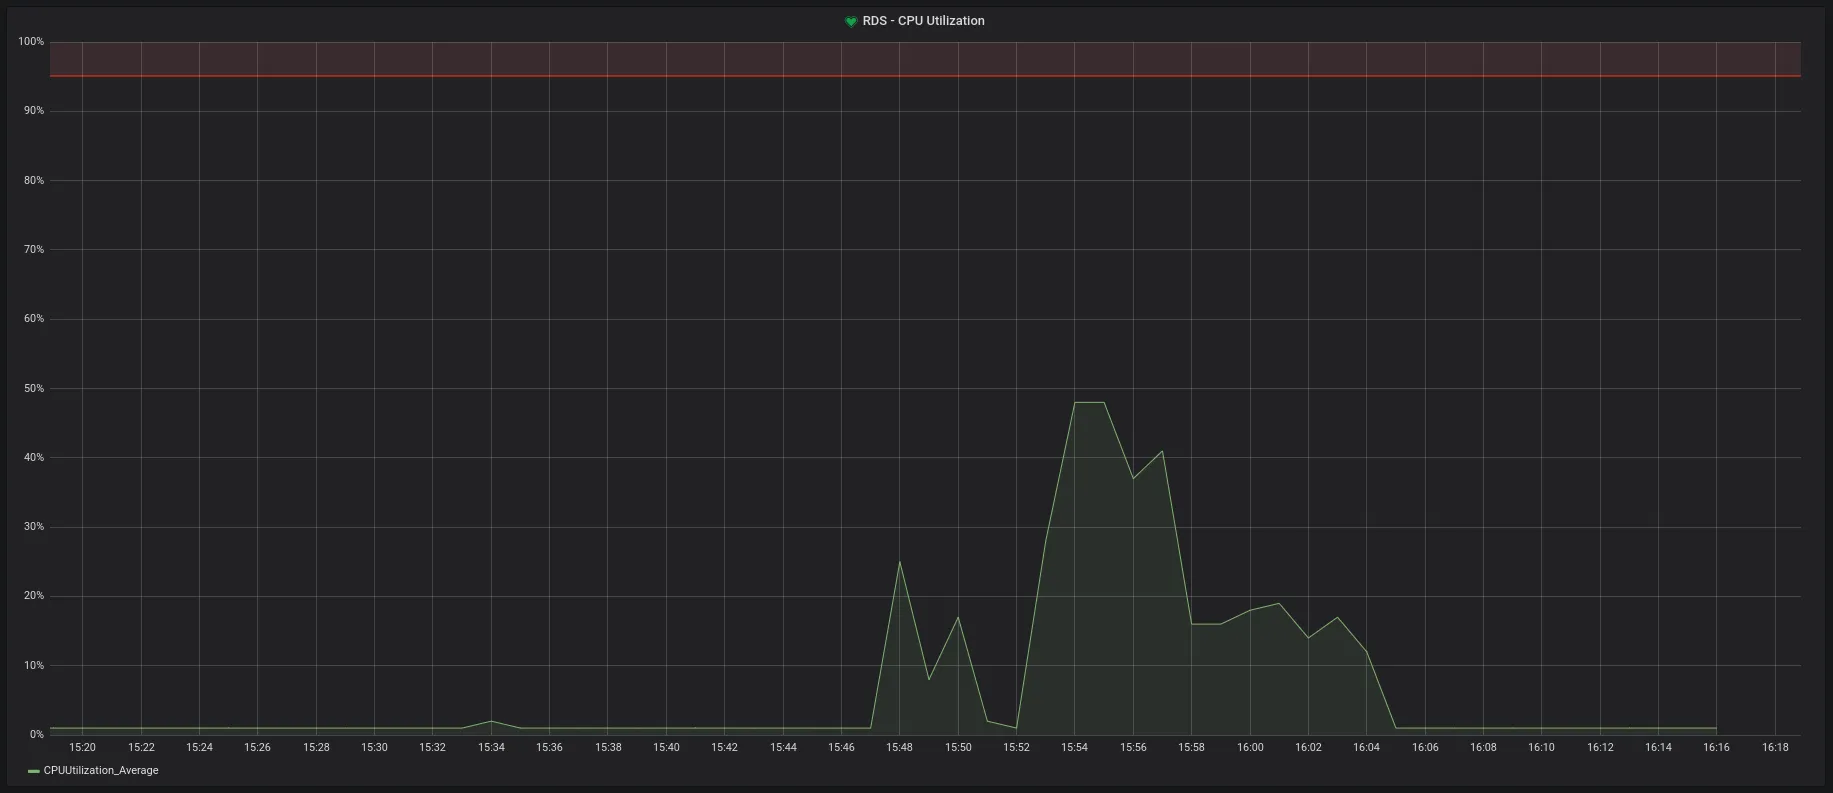
As you can see in this graph, we set an alert up for when the CPU reaches 80%. This is a high number which the CPU has a low chance to reach in a healthy situation. When this alert triggers, it’s a sign that it’s time to work on optimizing a query or a data structure.
Generate Logs
The best way to know where the pitfalls are is to activate logs. You can do so in the Postgres config.
The file is located at /etc/postgresql/9.6/main/postgresql.conf and is very well documented.
You should proceed with caution when modifying this file. You could break your database if a parameter is missing or misspelled.
Tip: You can also see the config in a SQL client with show my_wanted_parameter
Start by Updating The Config
In the Postgres config, you’ll see a lot of parameters. Fortunately, not all of them are useful at this point. The two following changes are a good start:
- Detect Slow Queries
log_min_duration_statement='300' # Time in milliseconds log_min_duration_statement='-1' # disable log_min_duration_statement='0' # log all queriesEvery query taking more than 300ms will be logged.
We do not recommend logging all the queries, because this will cause a lot of noise, and it will slow down both the system and your optimizing work. That’s why 300ms is generally a good start. But if you have very slow queries, you could use 500ms or even 1s.
- Measure The Temporary Files Size
log_temp_files = '0' # log all temp files log_temp_files = '1' # log temp files larger than 1 kB log_temp_files = '-1' # disableTemporary files are used when there is not enough memory to execute a query. If a query generates too heavy files, you should consider optimizing it.
All the params can be found in the documentation: Runtime Config Logging._
Find Logs
The easiest way to retrieve the log destination is to use the following command.
postgres=> show log_destination; log_destination----------------- stderr(1 row)You could set a file path instead of stderr. Read more about that in the article Where are my logs?.
If you use a hosted version of Postgres (like AWS RDS), there is a good chance that these logs are available trhough some sort of web UI. Most of the time, the UI offers poor search filters, so it’s better to download the files and to grep these files by hand.
Use a Log Analyzer Tool
Now that we have the material, let’s grab the right tool. In this part, we’ll show you how to generate a report from these logs with pgBadger, a great open-source log analyzer.
PgBadger parses a log file, and generates an easy to read report. Let’s see what it does, and how it works.
Generate a Report
Your first task is to parse your log file with pgBadger. It needs to know how you format your logs to be able to interpret them. In our case, the logs look like this:
2018-11-30 11:44:29 UTC:10.0.10.135(58630):root@pg:[23268]:DETAIL: parameters: $1 = '71'2018-11-30 11:44:56 UTC:10.0.11.103(46970):root@pg:[22747]:LOG: duration: 426.736 ms execute <unnamed>: SELECT comment.id, [...]We need the following prefix:
- %t: 2018-11-30 11:44:29 UTC
- %r: 10.0.10.135(58630)
- %u@%d: root@pg
- [%p]: [23268]
To finally generate a report:
pgbadger postgresql.log --prefix="%t:%r:%u@%d:[%p]:"You can use -t to change the number of entries pgBadger reads (20 by default), and -o to specify an output file. See all the available params in the documentation.
Database Overview
PgBadger serves a database overview report as a web page. It’s very handy to dig deeper in the details. It will help you shed light on errors happening in the system.
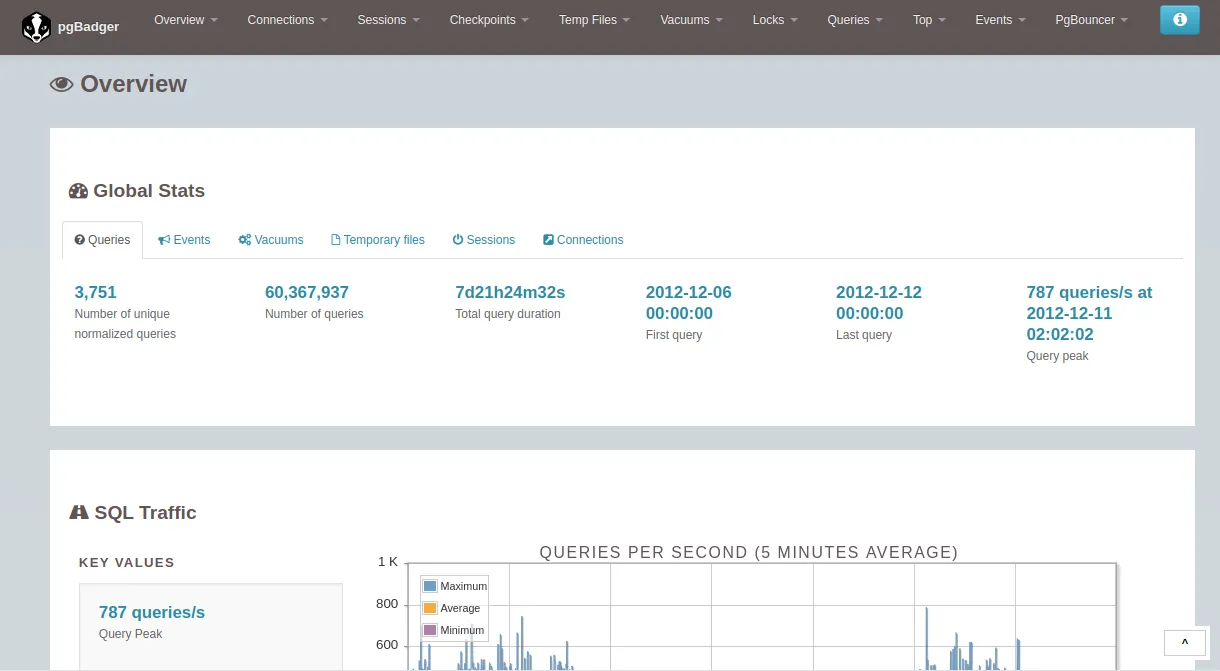
Use this example report if you don’t have your own.
The following pages are particularly relevant:
- Global Stats
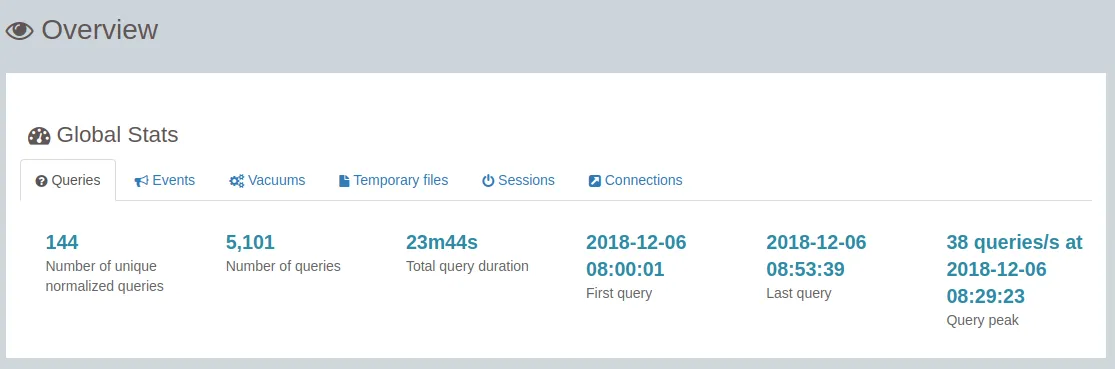
Tip: Don’t forget that pgBadger uses the server time and not the one from your browser.
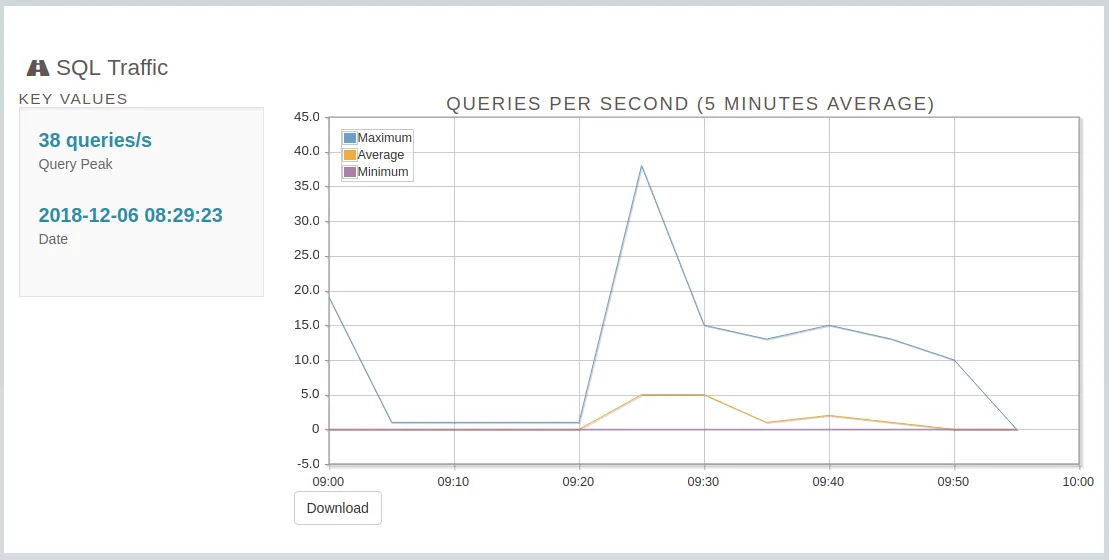
- Analyze SQL Traffic
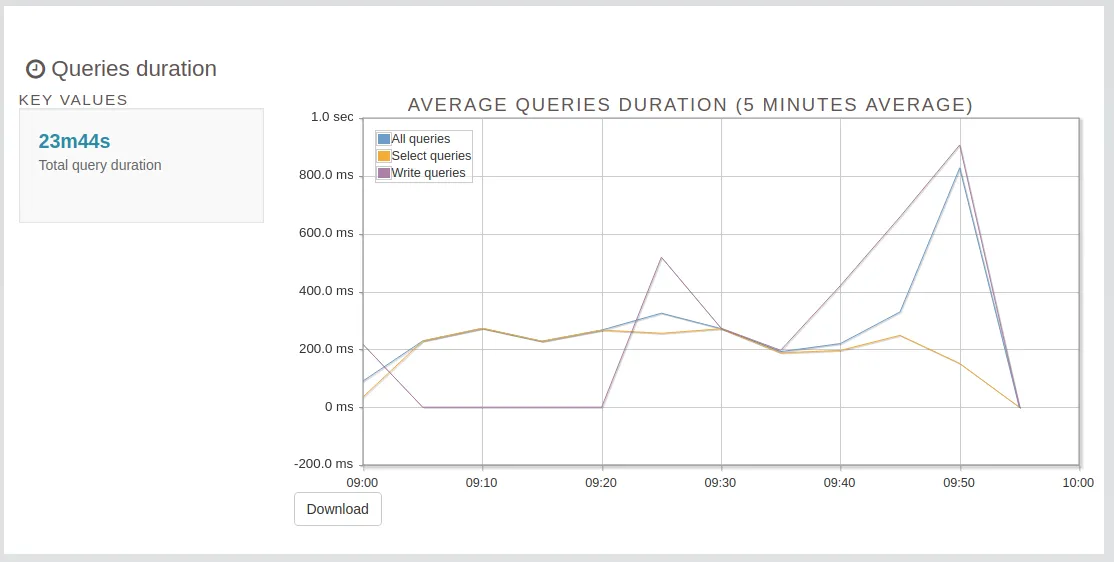
- Queries Duration
Top Queries
Top Queries is one of the best PgBadger feature. It helps to identify the slowest queries.
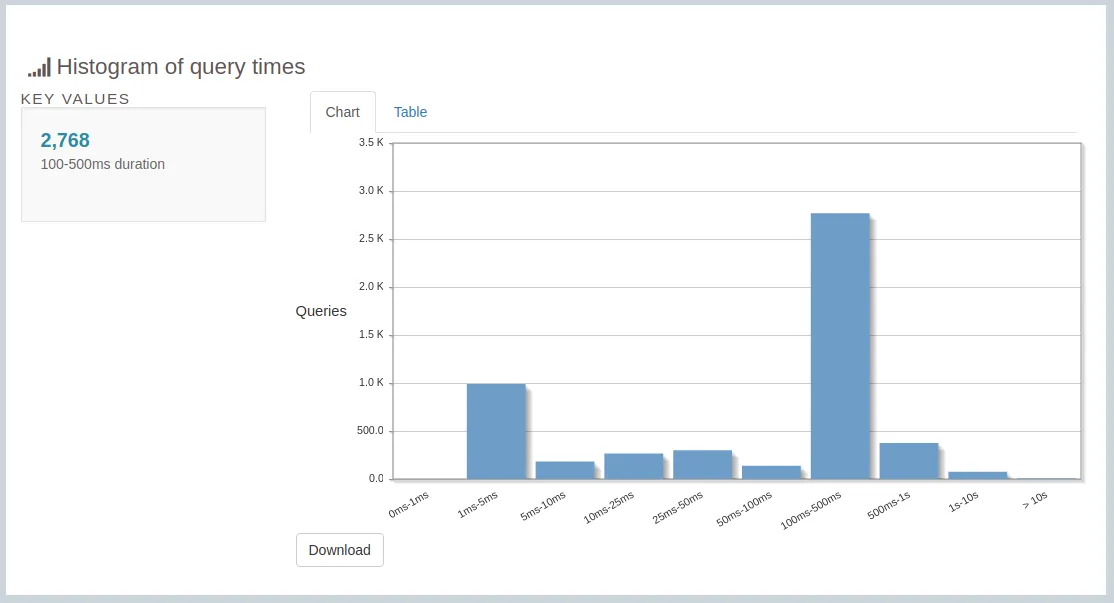
- Histogram of Query Times
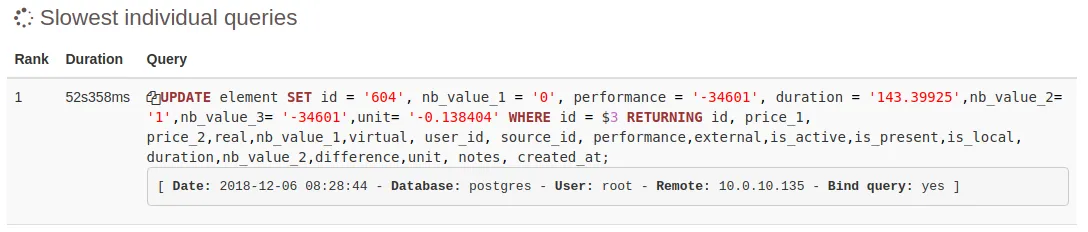
- Slowest Individual Queries
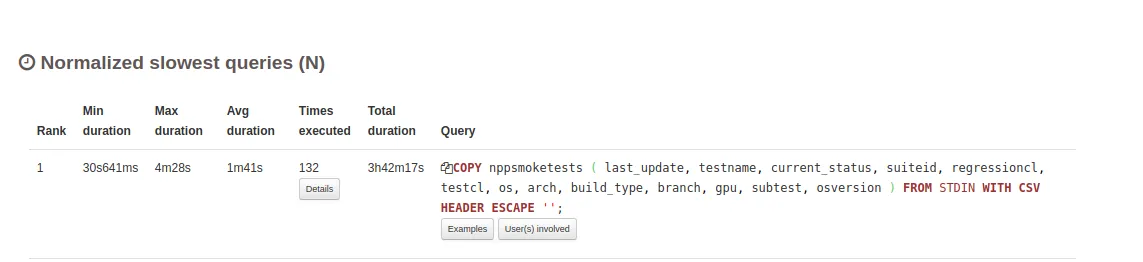
- Normalized Slowest Queries
A query can be fast, but if you call it too many times, the total time will be high. In that case, you should investigate if bulking the calls is feasible.
See more details in the following article: PostgreSQL Log Analysis with pgBadger.
Optimize Queries
For each slow query we spotted with pgBadger, we applied a 3 steps process:
-
Extract the query from the codebase
-
Replay the query with an explain plan
EXPLAIN ANALYZE SELECT * FROM test;Hash Anti Join (cost=57.26..96.69 rows=53 width=31) (actual time=0.702..1.003 rows=53 loops=1)Hash Cond: (developper.id = talent.foreign_id)-> Seq Scan on developper (cost=0.00..37.05 rows=205 width=47) (actual time=0.009..0.098 rows=205 loops=1)-> Hash (cost=46.56..46.56 rows=856 width=16) (actual time=0.682..0.682 rows=856 loops=1)Buckets: 1024 Batches: 1 Memory Usage: 49kB-> Index Scan on talent (cost=0.00..46.56 rows=856 width=16) (actual time=0.007..0.421 rows=856 loops=1)Planning time: 0.295 msExecution time: 1.051 msFirst you should pay attention to the quantity of
rowsandloops. The earlier you reduce these values, the faster the query will be. You will limit the data to manipulate and to load in memory.Seq scanmeans that the engine performed a full scan of the table. But it’s faster when it can do anIndex scan(see Index management few lines above).Explain plans can be difficult to read. The following article explains it better than we could: Reading an Explain Analyze Query-plan.
-
Optimize the query. In our case, we only had a few changes to apply for a significant impact:
-
Avoid
COUNT(*)and preferCOUNT(1)(*) means Postgres will get all columns before counting rows. With (1), it only gets the first column.
-
Be careful using the
WITHstatementWITHis a great tool to write complex queries simply. But the subqueries aren’t indexed. Don’t useWITHwithout a precise purpose.For example, for a large indexed table, the first query is much more slower than the second one.
WITH subtable AS (SELECT a FROM table_1)SELECT a FROM subtableWHERE a > 10;SELECT a FROM table_1 WHERE a > 10; -
Prefer
NOT EXISTStoLEFT JOIN ON null idConsidering the two following queries to extract all developers without talent:
Slow Query:
SELECT developper.nameFROM developperLEFT JOIN talent ON developper.id = talent.foreign_idWHERE talent.id IS NULLHash Right Join (cost=39.61..97.94 rows=1 width=31) (actual time=1.505..1.536 rows=53 loops=1)Hash Cond: (talent.foreign_id = developper.id)Filter: (talent.id IS NULL)Rows Removed by Filter: 856-> Seq Scan on talent (cost=0.00..46.56 rows=856 width=20) (actual time=0.008..0.308 rows=856 loops=1)-> Hash (cost=37.05..37.05 rows=205 width=47) (actual time=0.421..0.421 rows=205 loops=1)Buckets: 1024 Batches: 1 Memory Usage: 24kB-> Seq Scan on developper (cost=0.00..37.05 rows=205 width=47) (actual time=0.013..0.294 rows=205 loops=1)Planning time: 0.464 msExecution time: 1.585 msOptimized Query:
SELECT developper.nameFROM developperWHERE NOT EXISTS (SELECT 1 talent.id WHERE developper.id = talent.foreign_id)Hash Anti Join (cost=57.26..96.69 rows=53 width=31) (actual time=0.909..1.267 rows=53 loops=1)Hash Cond: (developper.id = talent.foreign_id)-> Seq Scan on developper (cost=0.00..37.05 rows=205 width=47) (actual time=0.009..0.103 rows=205 loops=1)-> Hash (cost=46.56..46.56 rows=856 width=16) (actual time=0.888..0.888 rows=856 loops=1)Buckets: 1024 Batches: 1 Memory Usage: 49kB-> Seq Scan on talent (cost=0.00..46.56 rows=856 width=16) (actual time=0.008..0.536 rows=856 loops=1)Planning time: 0.274 msExecution time: 1.050 msThe first query is slower and has more data to load at the begin of the plan. So always prefer using
NOT EXITSwhich is better optimized.
-
Manage Indexes
You could improve queries by better managing the table indexes.
Indexes help to identify the disk location of rows that match a filter. If there is no index, Postgres will have to do a sequential scan of the whole table. The more rows there are, the more time it will take. If you add an index, the query will be faster.
You can check missing primary keys with this query:
SELECT relname FROM pg_class WHERE relkind = 'r' AND relhaspkey IS false;In specific cases, it’s the opposite: indexes exist, but are not used. In this case, your system looses time to keep this index up to date for every insert or update statement. Detect unused indexes with the query below, and remove them:
SELECT * FROM pg_stat_user_tables WHERE schemaname='public' ORDER BY seq_scan DESC;Sometimes indexes are not used because there are not enough rows in the table. So if the table is new, you should wait a few weeks before removing them.
Conclusion
Investigating on database performance is a long journey, but to sum up, you should:
- Track your database to gather logs
- Extract the most relevant information
- Identify the issues
- Address them one by one
It’s always possible to do better, and spend more time to improve performance. To know when to stop, you may ask yourself: do the users complain about my app work performance? If it’s not the case anymore, it’s time to stop for now. But sometimes, these optimizations don’t solve the issue.
Two months ago, we used this process in one of our projects. Unfortunately, even with well optimized queries and indexes, we still had issues. In such a case, the solution is simple, but costly: we changed the hardware to use a better Postgres RDS instance.
It’s hardware that makes a machine fast. It’s software that makes a fast machine slow. (Craig Bruce)
Further reading on similar subjects:
- Postgres Performance Optimization
- Understanding Postgres Performance by Craig Kerstiens
- Finding And Fixing Node.js Memory Leaks: A Practical Guide by Kévin Maschtaler
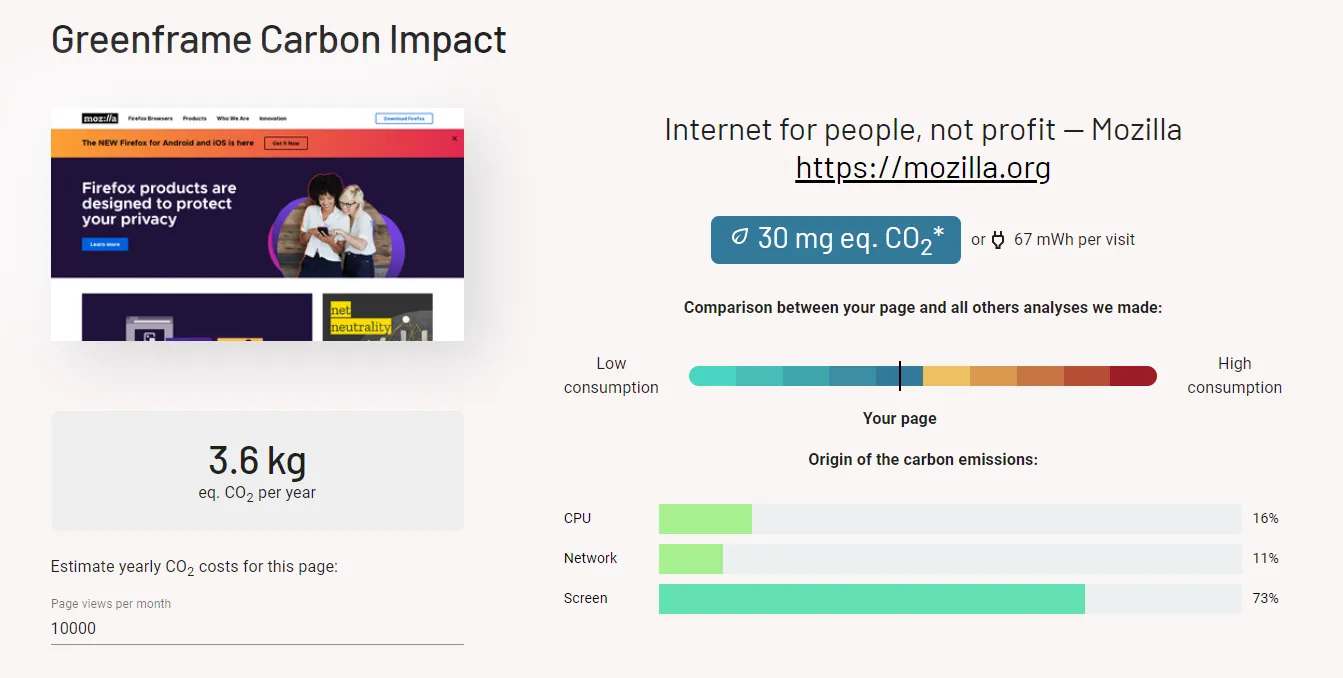
Does performance relate to energy consumption, and therefore to carbon emissions?
We’re building tools to answer that question. Check out GreenFrame.io, a free carbon tester for web pages, and contact us if you want to test your entire stack (from database to browser) for carbon emissions.
Authors
Full-stack web developer at marmelab, Adrien is a Software Engineer with a strong taste for agile project management. He's also a judoka! He has only one goal: discover Irene's identity.
Full-stack web developer at marmelab, Julien follows a customer-centric approach and likes to dig deep into hard problems. He also plugs Legos to computers. He doesn't know who is Irene...