
OpenTelemetry in Practice: Instrumenting JavaScript Apps for Tracing

In a previous blog post, we explained what application monitoring is and introduced the OpenTelemetry open-source project. The emergence of such a project enables us to expose our telemetry data to various Application Performance Management (APM) services with a single instrumentation on the application side.
In this blog post, we will see how to enable OpenTelemetry on Node.js APIs and their React client, based on our experience with a large multi-tier application. We will focus only on tracing, excluding metrics and logs for now. We will see how the full-stack traces can help us debug faster.
OpenTelemetry In A Nutshell
OpenTelemetry is an Observability framework and toolkit designed to create and manage telemetry data.
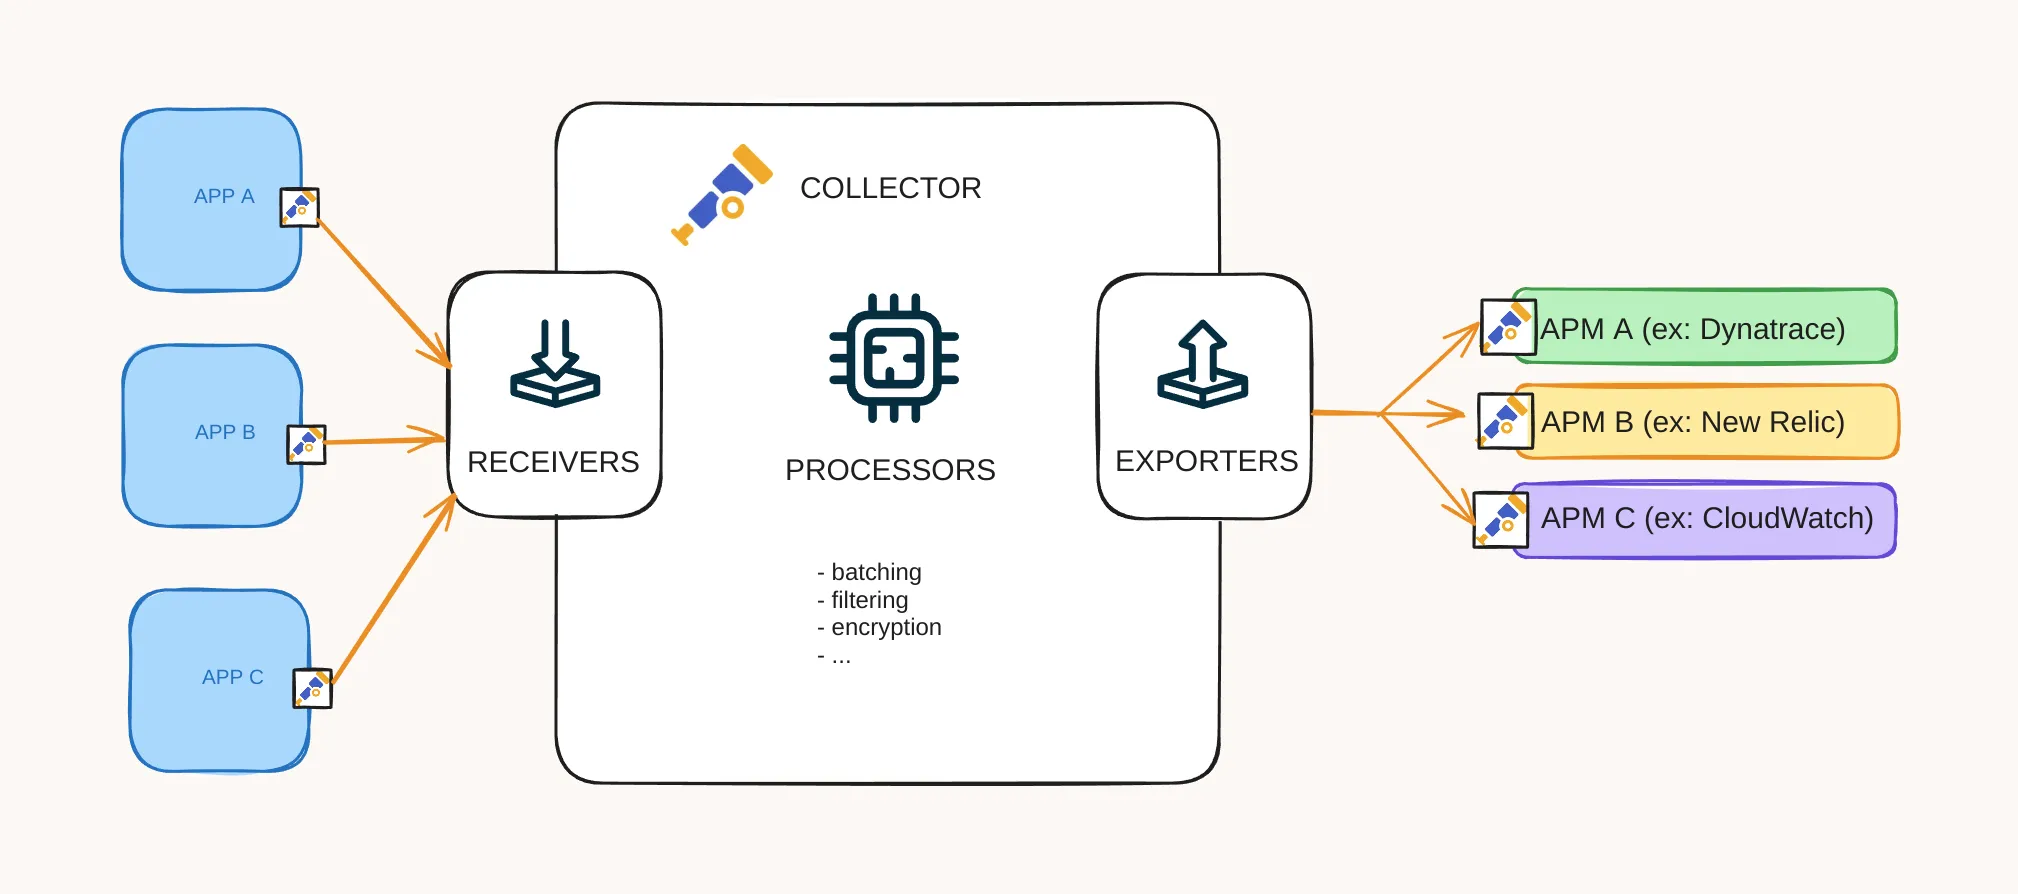
OpenTelemetry collects, processes, and exports telemetry signals (traces, metrics, and logs) from our applications to observability backends like Jaeger, Prometheus, or other commercial APM vendors.
OpenTelemetry provides specifications, APIs, and SDKs to instrument our applications.
One part of the specifications is the OTLP protocol. Respecting it allows our application to export these data to different backends or collectors.
The other part of the specifications is the semantic conventions. For each signal, OpenTelemetry defines a common set of semantic attributes such as span names and kinds, metric instruments and units, as well as attribute names, types, meanings, and valid values. Using these naming conventions allows for easy correlation and consumption of these data regardless of the codebase, libraries, and platforms.
For example, the trace signal is composed of spans. Each span is represented here by a bar.
A span must adhere to this semantics with a name, a context composed of a span_id and a trace_id (indicating which trace the span belongs to), and other attributes.
// a tracing span{ "name": "/v1/sys/health", "context": { "trace_id": "7bba9f33312b3dbb8b2c2c62bb7abe2d", "span_id": "086e83747d0e381e" }, "parent_id": "", "start_time": "2021-10-22 16:04:01.209458162 +0000 UTC", "end_time": "2021-10-22 16:04:01.209514132 +0000 UTC", "status_code": "STATUS_CODE_OK", "status_message": "", "attributes": { "net.transport": "IP.TCP", "net.peer.ip": "172.17.0.1", "net.peer.port": "51820", "net.host.ip": "10.177.2.152", "net.host.port": "26040", "http.method": "GET", "http.target": "/v1/sys/health", "http.server_name": "mortar-gateway", "http.route": "/v1/sys/health", "http.user_agent": "Consul Health Check", "http.scheme": "http", "http.host": "10.177.2.152:26040", "http.flavor": "1.1" }, "events": [ { "name": "", "message": "OK", "timestamp": "2021-10-22 16:04:01.209512872 +0000 UTC" } ]}Finally, OpenTelemetry offers an extensive and developer-friendly documentation. Whether you’re new to observability or an experienced user, you will probably manage to quickly set up OpenTelemetry.
APIs And SDK
OpenTelemetry supports multiple languages like JS, Python, and Java. For each language, OpenTelemetry proposes an SDK to generate telemetry data.
These are the two JavaScript repositories:
- opentelemetry-js: Primary repository containing the core distribution API and SDK.
- opentelemetry-js-contrib: Extends the core distribution with extra features. We’ll be using this one as it notably contains automatic instrumentation packages for Node.js and web applications.
Introducing The Collector
The OpenTelemetry Collector proposes a vendor-agnostic implementation of how to receive, process, and export telemetry data.
Using a Collector is not mandatory. We have the option to send our telemetry data directly to an observability backend.
But it is highly recommended. In fact, the collector can take care of retries, batching, encryption, or even sensitive data filtering. It facilitates rapid offloading of telemetry data.
Setting Up A Collector
Following the documentation, here is how we set up a collector.
In a new directory, we create a config file named collector-config.yaml with the following content:
receivers: otlp: protocols: grpc: endpoint: 0.0.0.0:4316 http: endpoint: 0.0.0.0:4319 cors: allowed_origins: - http://localhost:8082exporters: debug: verbosity: detailed otlp/jaeger: # Jaeger supports OTLP directly. The default port for OTLP/gRPC is 4317 endpoint: jaeger:4317 tls: insecure: trueservice: pipelines: traces: receivers: [otlp] exporters: [otlp/jaeger, debug] metrics: receivers: [otlp] exporters: [debug] logs: receivers: [otlp] exporters: [debug]We want to visualize tracing spans, so, in the exporters section, we configure the OTLP exporter to send traces to Jaeger, a distributed tracing observability platform, which natively supports OTLP.
We create a docker network to easily communicate between our app, the collector, and the Jaeger docker containers.
docker network create -d bridge otlp-networkThis is the code to run the OpenTelemetry Collector docker:
docker run --network=otlp-network --network-alias=otlpcollector \ -p 4316:4316 -p 4319:4319 \ --rm -v $(pwd)/collector-config.yaml:/etc/otelcol/config.yaml \ otel/opentelemetry-collectorAnd here is how to run the Jaeger docker, still according to the OpenTelemetry documentation:
docker run --rm -e COLLECTOR_OTLP_ENABLED=true \ -e COLLECTOR_ZIPKIN_HOST_PORT=:9411 \ -p 16686:16686 -p 4317:4317 \ -p 4318:4318 -p 9411:9411 \ --network=otlp-network --network-alias=jaeger \ jaegertracing/all-in-one:latestThe Jaeger interface is available at http://localhost:16686/search.
Once the collector is configured, we can now connect any application capable of communicating via the OTLP format over HTTP or gRPC.
Adding Tracing To NodeJS Apps
The OpenTelemetry JavaScript documentation is actually pretty good. It explains how to instrument both a Node.js backend and a JS frontend.
For instrumentation of JavaScript backend applications, there are two types of instrumentations: automatic and manual.
- Automatic instrumentation provides a convenient way to instrument Node.js applications by automatically generating telemetry data from external dependencies like HTTP, fs, knex, etc.
- Manual instrumentation offers more control and customization options but requires additional effort to implement.
OpenTelemetry advises configuring automatic instrumentation first, and then enriching your code with manual instrumentation as needed.
First, we instrument our Node.js backend app1 that communicates with a PostgreSQL database.
We install the packages.
yarn add \@opentelemetry/sdk-node \@opentelemetry/api \@opentelemetry/auto-instrumentations-node \@opentelemetry/sdk-metrics \@opentelemetry/sdk-trace-node \@opentelemetry/exporter-metrics-otlp-proto \@opentelemetry/exporter-trace-otlp-protoAnd then we create a file opentelementry.ts in our application.
import { getNodeAutoInstrumentations } from "@opentelemetry/auto-instrumentations-node";import { OTLPMetricExporter } from "@opentelemetry/exporter-metrics-otlp-proto";import { OTLPTraceExporter } from "@opentelemetry/exporter-trace-otlp-proto";import { PeriodicExportingMetricReader } from "@opentelemetry/sdk-metrics";import * as opentelemetry from "@opentelemetry/sdk-node";
const sdk = new opentelemetry.NodeSDK({  traceExporter: new OTLPTraceExporter({    url: "http://otlpcollector:4319/v1/traces",  }),  metricReader: new PeriodicExportingMetricReader({    exporter: new OTLPMetricExporter({      url: "http://otlpcollector:4319/v1/metrics",    }),  }),  instrumentations: [getNodeAutoInstrumentations()],});
sdk.start();$ npx ts-node --require ./opentelemetry.ts app.tsWe add the --require flag to load instrumentation before running our application.
We also add the network otlp-network to the application’s Docker Compose to allow communication with the collector.
services: app1: build: context: ./app1 dockerfile: Dockerfile ports: - 8081:8081 environment: - OTEL_SERVICE_NAME=app1 networks: - otlp-networkOpenTelemetry reads an environment variable OTEL_SERVICE_NAME that is set to “app1”` to correctly display the service name.
After running the application, we open Jaeger to see the spans of this new app1 service.
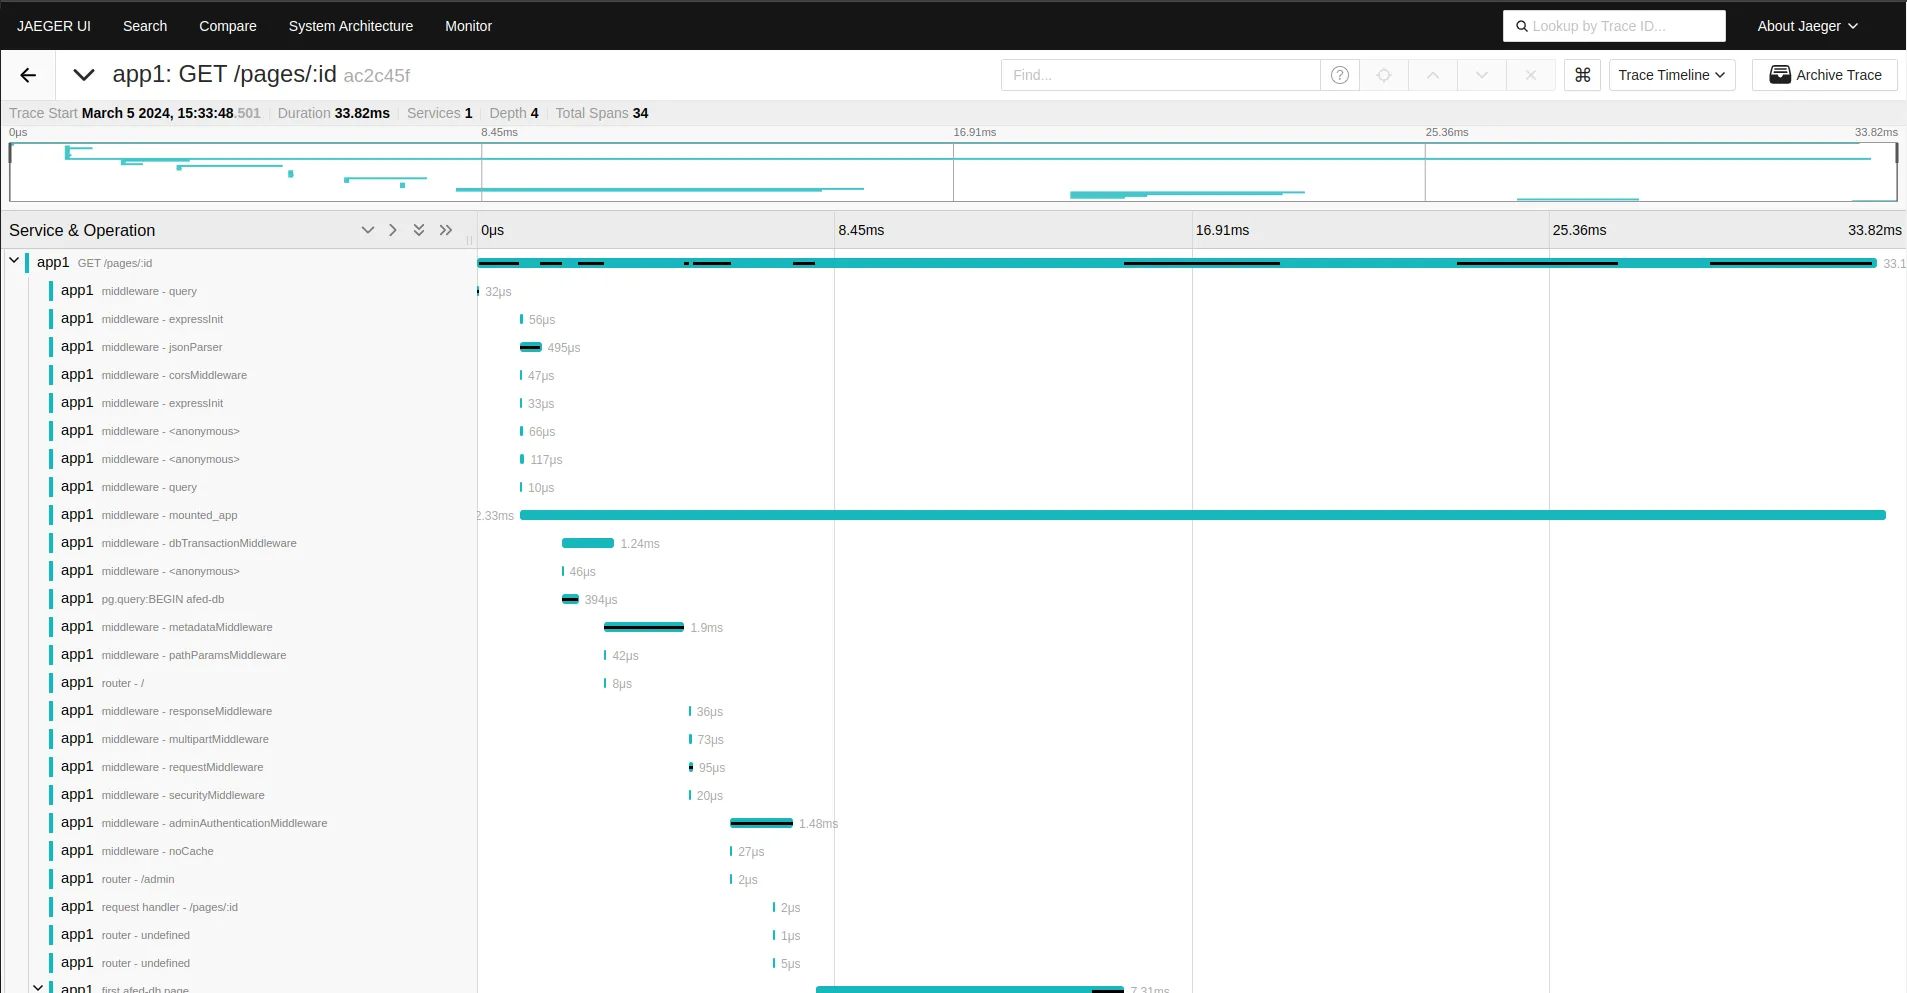
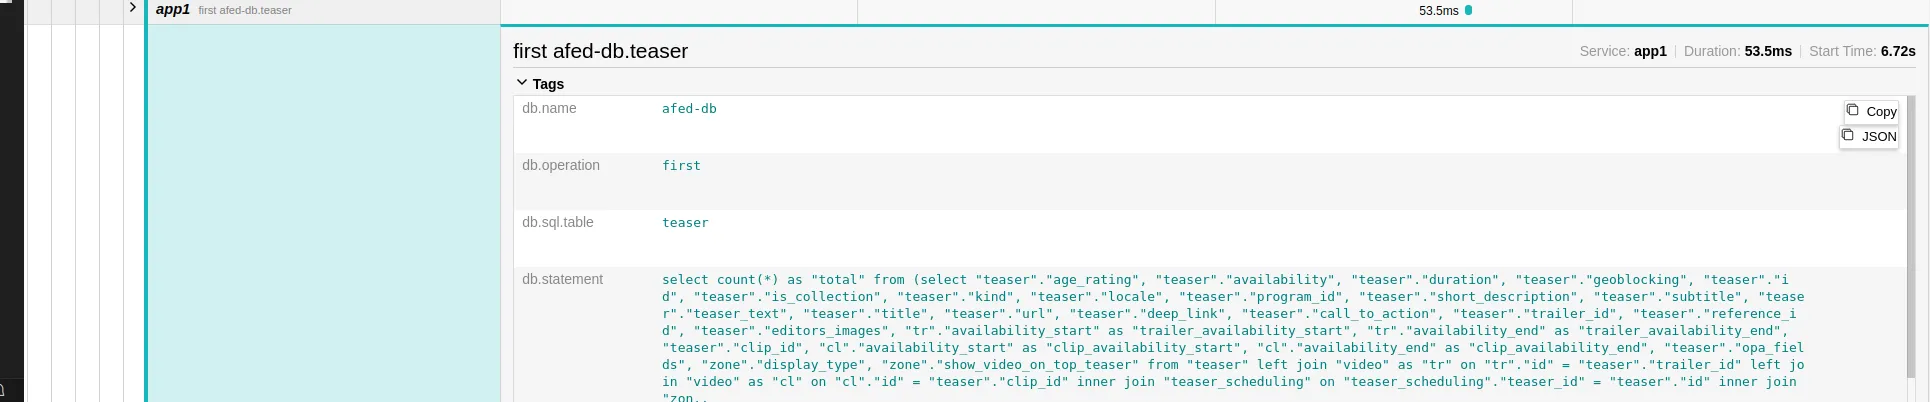
The last spans are PostgreSQL ones because we use knex to communicate with the database. Auto-instrumentation includes instrumentation of commonly used libraries in Node.js such as Express, fs, or even knex.
For example, we can obtain the executed SQL query.
Once one application is instrumented, is it as simple to instrument our other Node.js applications? Will the correlation between these different backends occur smoothly?

In two other of our Node.js applications, app2 and app3, we:
- Modify the command to load the instrumentations before launching the application,
- Add the environment variable corresponding to the service name
OTEL_SERVICE_NAME, - Add the network
otlp-networkto the application’s Docker Compose.
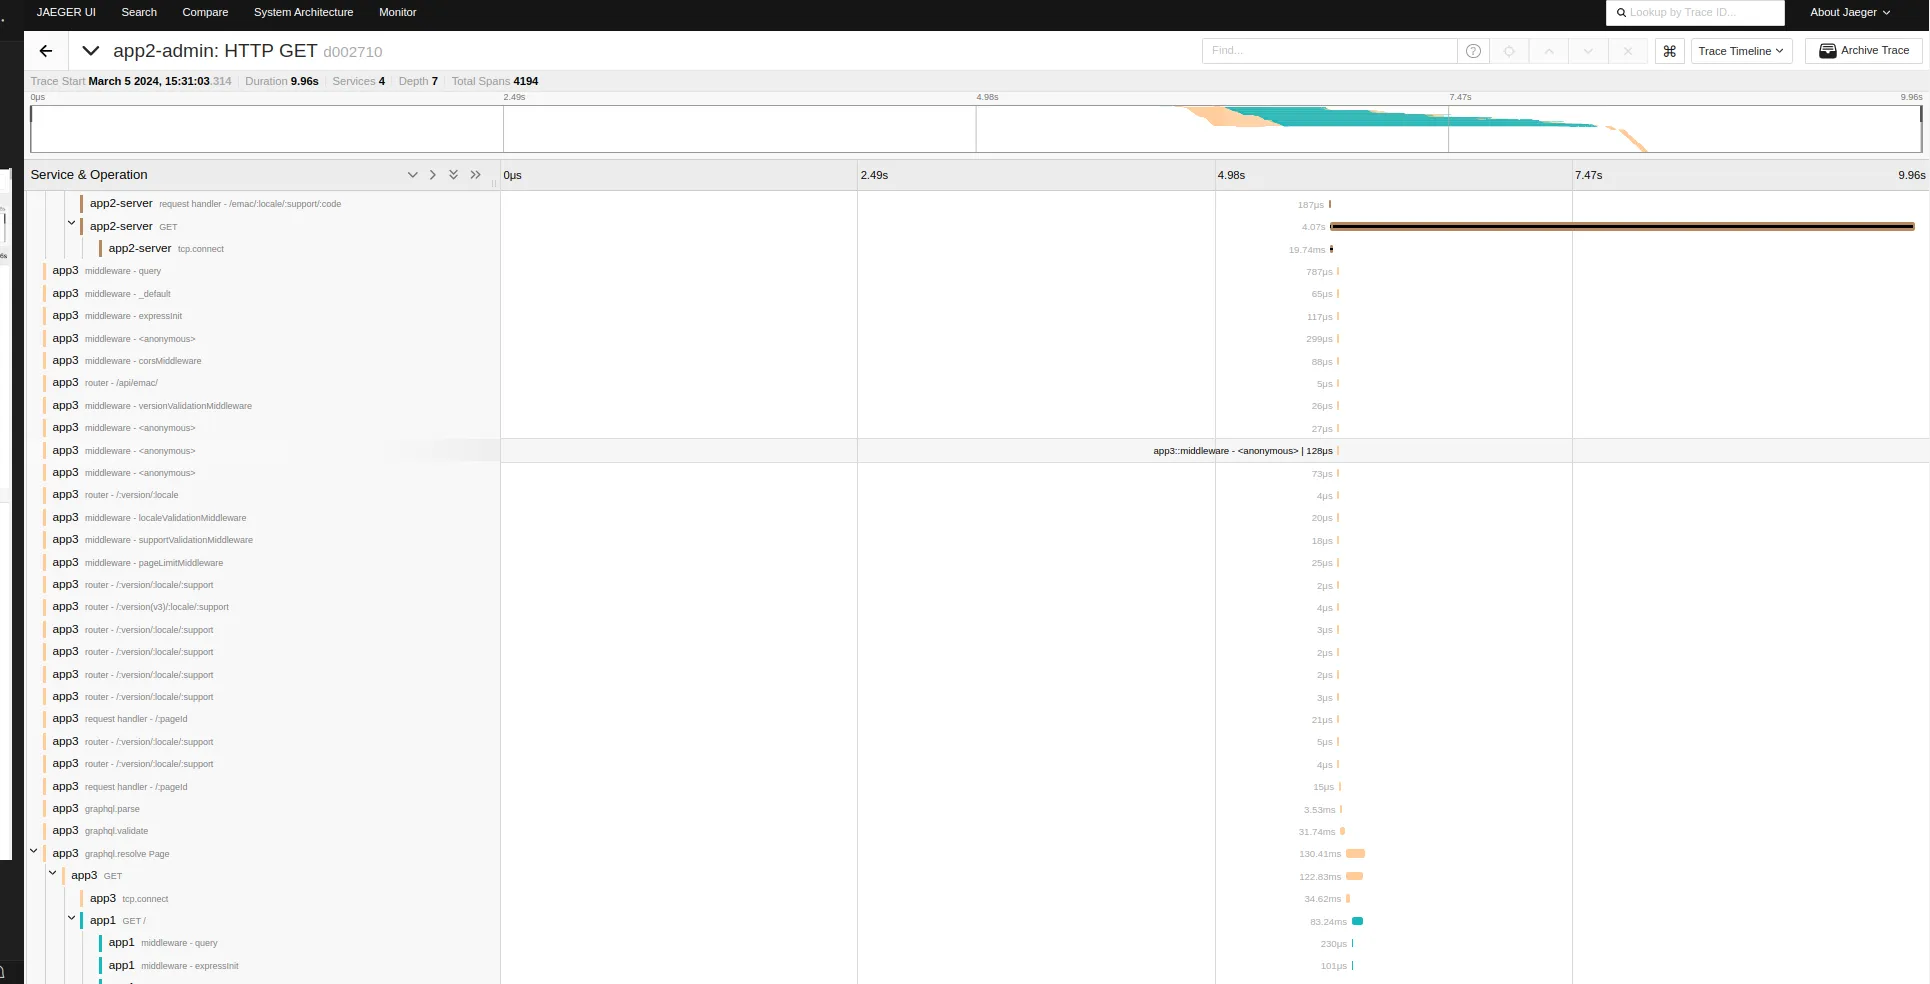
Running all our apps and opening Jaeger, we can now see three services correlated for one trace.
Tip: In production, it’s important to configure the OTEL_LOG_LEVEL to info to avoid impacting the performance of our application with the automatic instrumentation.
Adding Tracing To Client-Side JavaScript Apps
What about frontend instrumentation?
There is a Javascript automatic web instrumentation available, but it’s much newer and therefore less well-documented than the node.js instrumentation, but let’s give it a try.
We install different packages for our app2-admin application:
yarn add \@opentelemetry/sdk-trace-web \@opentelemetry/sdk-trace-base \@opentelemetry/auto-instrumentations-web \@opentelemetry/api \@opentelemetry/context-zone \@opentelemetry/core \@opentelemetry/resources\@opentelemetry/semantic-conventions\@opentelemetry/instrumentation \@opentelemetry/exporter-trace-otlp-httpAnd then we create a file opentelementry.ts in our application.
import { getWebAutoInstrumentations } from "@opentelemetry/auto-instrumentations-web";import { ZoneContextManager } from "@opentelemetry/context-zone";import { WebTracerProvider } from "@opentelemetry/sdk-trace-web";import {  CompositePropagator,  W3CBaggagePropagator,  W3CTraceContextPropagator,} from "@opentelemetry/core";import { Resource } from "@opentelemetry/resources";import { SemanticResourceAttributes } from "@opentelemetry/semantic-conventions";import { registerInstrumentations } from "@opentelemetry/instrumentation";//exportersimport { BatchSpanProcessor } from "@opentelemetry/sdk-trace-base";import { OTLPTraceExporter } from "@opentelemetry/exporter-trace-otlp-http";
// The SemanticResourceAttributes is an enum that provides a set of predefined attribute keys for commonly used attributes in OpenTelemetry to maintain consistency across different OpenTelemetry implementationsconst resourceSettings = new Resource({  [SemanticResourceAttributes.SERVICE_NAME]: "app2-admin",  [SemanticResourceAttributes.SERVICE_VERSION]: "0.0.1",});
const traceExporter = new OTLPTraceExporter({  url: "http://localhost:4319/v1/traces",});
const provider = new WebTracerProvider({ resource: resourceSettings });
// The BatchSpanProcessor is responsible for batching and exporting spans to the configured exporter (newRelicExporter in this case).provider.addSpanProcessor(  new BatchSpanProcessor(    traceExporter,    //Optional BatchSpanProcessor Configurations  ),);
// ZoneContextManager is a context manager implementation based on the Zone.js library. It enables context propagation within the application using zones.provider.register({  contextManager: new ZoneContextManager(),  // Configure the propagator to enable context propagation between services using the W3C Trace Headers  propagator: new CompositePropagator({    propagators: [new W3CBaggagePropagator(), new W3CTraceContextPropagator()],  }),});
const startOtelInstrumentation = () => {  console.error(`Registering Otel ${new Date().getMilliseconds()}`);  // Registering instrumentations  registerInstrumentations({    tracerProvider: provider,    instrumentations: [      getWebAutoInstrumentations({        "@opentelemetry/instrumentation-xml-http-request": {          enabled: true,          ignoreUrls: ["/localhost:8081/sockjs-node"],          clearTimingResources: true,          propagateTraceHeaderCorsUrls: [new RegExp("http://localhost:3002")], //backend url        },        "@opentelemetry/instrumentation-document-load": {          enabled: true,        },        "@opentelemetry/instrumentation-user-interaction": {          enabled: true,        },        "@opentelemetry/instrumentation-fetch": {          propagateTraceHeaderCorsUrls: [new RegExp("http://localhost:3002")], //backend url          enabled: true,        },      }),    ],  });};
export { startOtelInstrumentation };
As we can see, instrumentation appears to be much more complex than for the backend.
Frontend instrumentation can cause CORS issues. That’s why we need to specify the backend URL in the propagateTraceHeaderCorsUrls property in order to propagate the trace_id. However, this alone is not sufficient; we also need to allow the traceparent header at the backend level (see W3 documentation).
To initialize web instrumentation, we import it at the application level.
import React from "react";import ReactDOM from "react-dom/client";import App from "./App";import "./index.css";import { startOtelInstrumentation } from "./instrumentation";
// Add this before the initialization of your main App, so it can capture all the traces.startOtelInstrumentation();
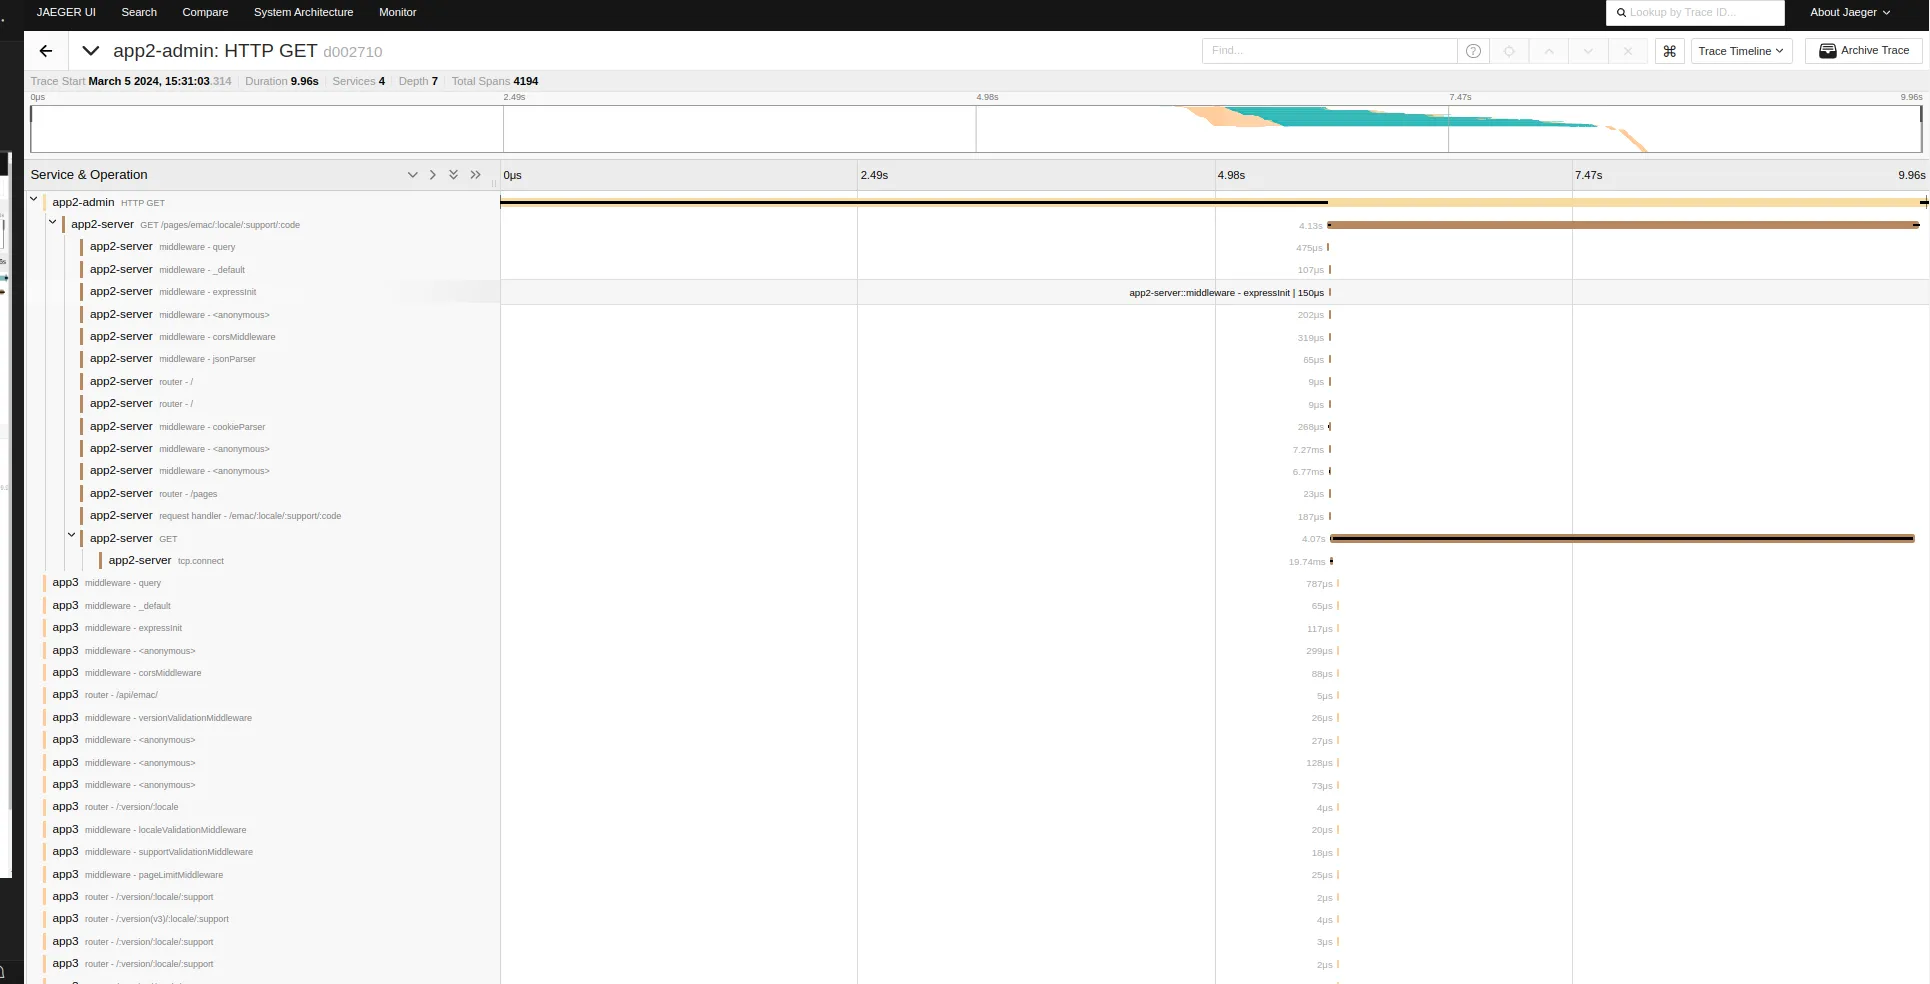
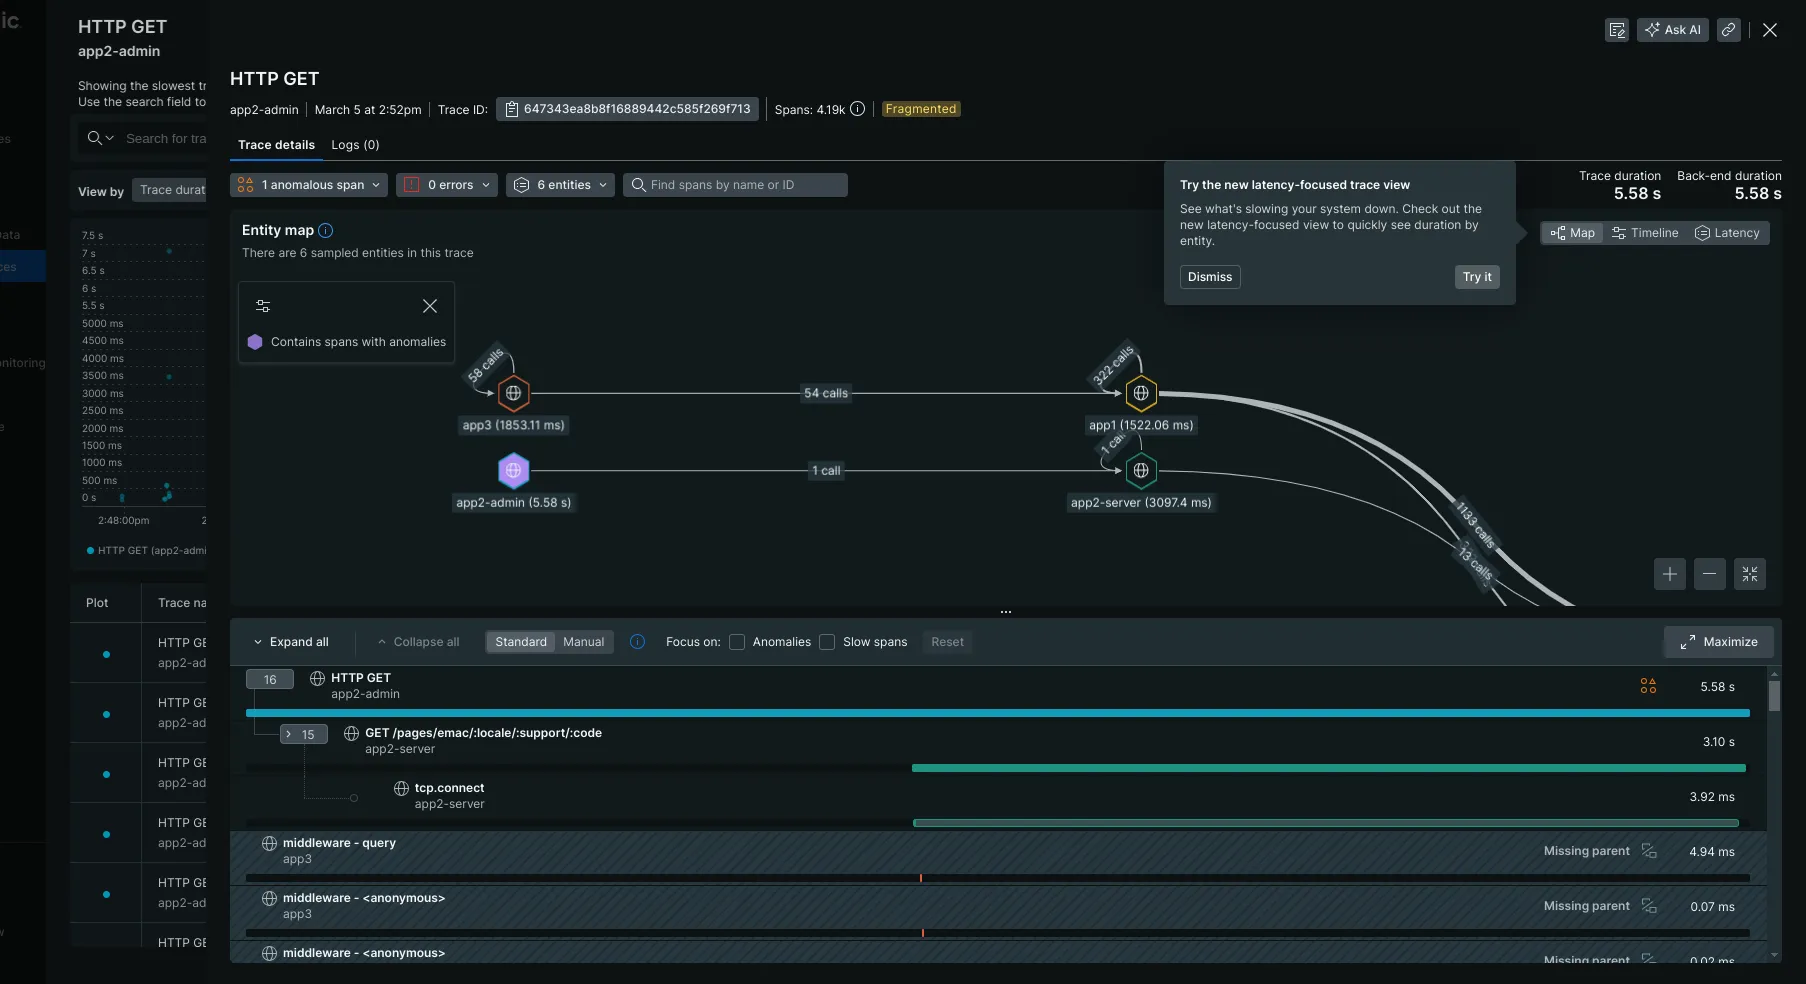
ReactDOM.createRoot(document.getElementById("root") as HTMLElement).render( <React.StrictMode> <App /> </React.StrictMode>,);Running all our apps and opening Jaeger, we can now see all our services correlated for one trace.
Exporting Traces To New Relic
We have seen how to export our traces to Jaeger. What about exporting them to New Relic?
We need to change the collector version to contrib because the New Relic exporter doesn’t exist in the core version. Once done, we can now configure the exporter with the New Relic API key.
exporters: otlp/newrelic: endpoint: https://otlp.eu01.nr-data.net:4317 headers: api-key: API_KEYThis is the result in New Relic APMs:
Conclusion
In this blog post, we explored the OpenTelemetry project, its components, and the process of instrumenting JavaScript applications for the tracing signal.
We also saw the relatively simple setup of an OpenTelemetry collector, even though we didn’t fully exploit all the benefits it promises like batching or filtering data.
Automatic instrumentation of tracing was relatively easy to set up thanks to the documentation, especially for Node.js applications. We haven’t added OLTP instrumentation for metrics and logs yet. We hope it’s as easy as instrumenting traces.
For us, the use of OpenTelemetry has become a must-have, and we are eager to deploy it in production. However, there is still much configuration to be done before we can reach this stage, especially in a Kubernetes-like environment as explained by Jérôme TAMA in this conference. Additionally, OpenTelemetry is still an ongoing project, and its approach to observability can be controversial, as it is explained in this blog post.
If you want to get an idea of what OpenTelemetry can bring to an ecosystem with a multitude of applications using different languages, we encourage you to download the official demo.
Authors
Before choosing full-stack development, Cindy was a dentist. No kidding. You can imagine that she's a fast learner.