

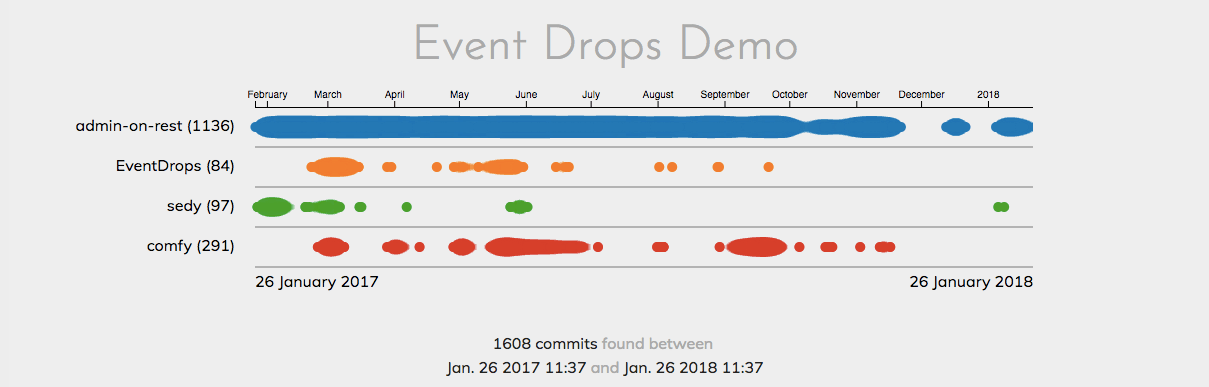
EventDrops, The Time Series Data Visualization, Gets a Major Performance Boost

It's been a long time since we last spoke about EventDrops, our time series data visualization based on D3.js. After several months of hard work, we can announce the good news: EventDrops 1.0 is out!
We rewrote entirely the EventDrops core from scratch. Indeed, the previous version of the code was hard to maintain and optimize,and its API felt a bit too "magic". So, we've decided to start from a fresh project, with three main focuses:
- Performance: 0.3.0 was really slow, reaching sometimes 5 FPS while zooming,
- Simplified configuration: who wants to write a complex function to tune hours format?
- Better test coverage: increase test coverage to reduce regressions,
- Better versioning: no more merged PR without a new release.
This new 1.0 version is "just" a polished version of event-drops. Here are the exciting improvements we made these last weeks.
Performance Boost
As a picture worths thousand words, here is the performance diff based on the same dataset:
EventDrops 0.3:

EventDrops 1.0:
While zooming or panning with the previous version, we noticed some performance drops (easy pun) going down to 5 frames per second. Needless to say, it felt terribly at the UX level. With the new version, the framerate never goes below 55 FPS. Far smoother experience.
How did we achieve such a feat? Simply by re-reading carefully the D3 documentation, and more particularly how joins work (including the very famous enter and exit duo). Instead of redesigning the entire chart for each movement, we let D3 compute intelligently what it needs to update.
In practice, here is how it is done with drops:
const drops = selection
  .selectAll(".drop")
  .data(filterOverlappingDrop(xScale, dropDate));

drops
  .enter()
  .append("circle")
  .classed("drop", true)
  .attr("r", dropRadius)
  .attr("fill", dropColor)
  .on("click", onClick)
  .on("mouseover", onMouseOver)
  .on("mouseout", onMouseOut)
  .merge(drops)
  .attr("cx", d => xScale(dropDate(d)));

drops
  .exit()
  .on("click", null)
  .on("mouseover", null)
  .on("mouseout", null)
  .remove();
We first select all .drop elements. Then, when we get a new piece of data, we follow the .enter() method. It appends a circle element with a few properties set on it. When the related data is removed (for instance when a drop leaves the viewport), the .exit() method is called: it remove() the DOM element.
D3 version 1.0 introduces the merge function, which merges (what a well chosen name!) two selections together. Here, it merges the newly created nodes with already existing ones. It prevents repeating the update of cx attribute. This code is equivalent to:
drops
  .enter()
  .append("circle")
  .attr("cx", d => xScale(dropDate(d)));

drops.attr("cx", d => xScale(dropDate(d)));
Note that to deliver still higher performances, we filter all drops too close to be distinguished. This is the aim of the filterOverlappingDrop function.
The theory of the enter() and exit() functions in D3 looks simple. Yet, in practice, when you use sub-selections (a chart contains drop lines containing drops), it becomes a little trickier. Let's take advantage of this article to highlight a particular point in the documentation, which made us lose a few hours when implementing this new version:
The data is specified for each group in the selection. If the selection has multiple groups (such as d3.selectAll followed by selection.selectAll), then data should typically be specified as a function. This function will be evaluated for each group in order, being passed the group’s parent datum (d, which may be undefined), the group index (i), and the selection’s parent nodes (nodes), with this as the group’s parent element.
The D3 documentation really drops (!) my mind, probably because of its too high level of abstraction. To sum up this paragraph in short words: if you use a selection within another selection, you have to pass it a function to filter out only desired data.
const lines = selection.selectAll(".drop-line").data(d => d);The selection data is an array of data lines. Yet, if we want to transfer the selection data to a .drop-line sub-selection, we need to specify how it is done using a function: here we return the whole line.
Simplified Configuration
Another major step was to simplify the configuration of the data visualization. Instead of a big single-level configuration, we now provide a configuration object using several embedded objects. For instance, instead of having both labelsWidth and labelsPadding arguments, we now have a label object with width and padding keys.
We also tried to reduce number of available options. Instead of having an extra zoomable parameter, we just set false to the zoom configuration key (instead of a zoom configuration object). The same logic is applied for bounds.
Finally, we removed some useless (in our opinion) complexity in some other parameters. Hence, the tickFormat option has been replaced by an axis.formats parameter. And, instead of passing it a complex multi-scale function, we now pass a map such as:
{
    axis: {
        formats: {
            milliseconds: '%L',
            seconds: ':%S',
            minutes: '%I:%M',
            hours: '%I %p',
            days: '%a %d',
            weeks: '%b %d',
            months: '%B',
            year: '%Y',
        },
    },
}
Far more readable than the previous version, and it should still fit most user needs.
In this new release, we assume a simpler configuration, based on both feedbacks we received on GitHub, and our own internal use. We never had the need to tune more finely the time scale format for instance. However, if it is your case, feel free to open an issue on GitHub. We'll work on reimplementing the missing feature back.
Better Test Coverage
In the past, we had several regressions, some of them being repeated over time. The previous code base was quite difficult to test because of its architecture. With this rewrite, we redesigned the whole architecture to be easily testable.
We also switch from Karma to Jest. Testing D3 with Jest is really easy, thanks to the jsdom environment embedded within Jest. Its DX-friendly interface and its coverage utility really make Jest a great fit for this project.
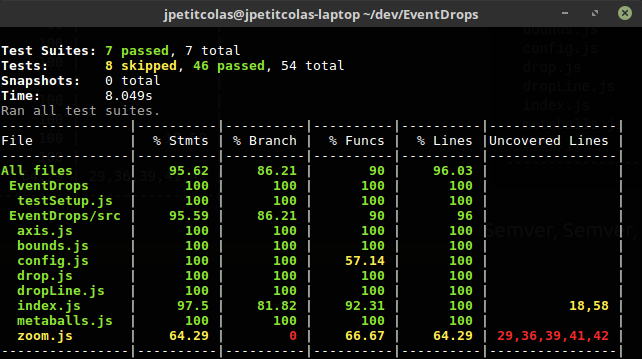
As highlighted in the previous output, there are still some missing tests, especially about the zoom part. We didn't find a way to trigger programmatically events used by zoom behavior. Yet, as done is better than perfect, we decided to ship the 1.0 version, postponing these tests to a near future.
This way, we hope no one will have to write the same issue twice. There's nothing more horrifying than praying to the Internet Gods every time a package is updated, hoping that the features we rely on are not broken.
Semver, Semver, Semver!
Finally, another recurrent trouble we noticed on GitHub is the difference between the released npm package and current master code. We may have fixed a critical bug on GitHub, but not having released it yet.
To solve this issue, we decided to use semver at each merge. At each pull request merge, there will be an extra release on npm. We hope it will be less WTF-prone for our end-users.
Conclusion
We hope you will enjoy this new version. And don't forget to give us your feedbacks, the only fuel of our open-source projects!
