Argos: Measure The Carbon Footprint Of Software, Improve Developer Practices

I’m super excited to share a preview of Argos, a tool that measures the environmental footprint of software. We’ve been working on building Argos for the past 6 months. We believe we’ve reached a point where Argos provides actionable metrics to improve development practices and help developers fight climate change. We’re releasing the Argos code with an Open-Source license.
This article will describe our journey in detail:
- Metrics: The Key to Reducing The Environmental Impact of Digital Activity
- Existing Measurement Tools Aren’t Enough
- What Developers Need To Improve Their Practices
- Introducing Argos
- Argos In Practice
- Next steps
- Conclusion
April 2021 Update: Argos is now available for test. We’ve renamed it to GreenFrame for trademark reasons.
Let’s dive in!
Metrics: The Key to Reducing The Environmental Impact of Digital Activity
As we’ve explained in our series Developers Can Save The Planet, we’re deeply concerned by the impact of our job on global warming. Digital devices and activities account for 4% of greenhouse gas (GHG) emissions, a score that increases 8% year-over-year (source: the Shift Project). We care about our impact as a software development company, and we want to deliver more sustainable software to our customers. So we need to improve our development and hosting practices to build lighter, less power-hungry applications, and we must do it now.
But what does “improve our practices” means? I have no idea. The few “Green IT” best practices guides that I’ve found (like ecometer.org) are great, but they don’t provide any proof that these practices have a significant impact on GHG emissions. And I can’t check that, after applying some of these practices on my website, its environmental footprint has changed. Because there is no tool that measures the complete environmental footprint of a digital service.
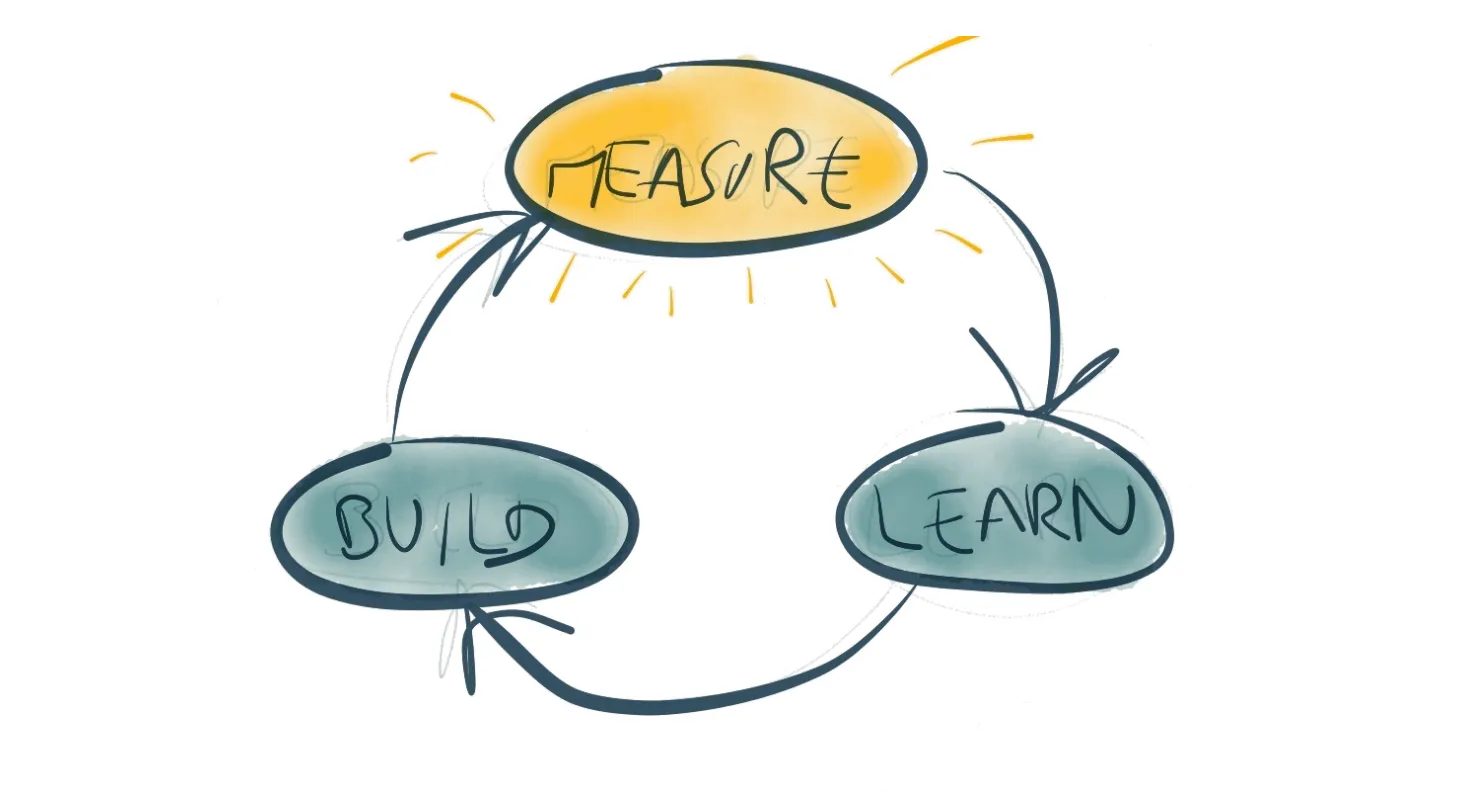
We can only improve what we measure, so we need better measuring tools for digital services.
Existing Measurement Tools Aren’t Enough
Here are the tools we’ve found to estimate the environmental footprint of a digital system:
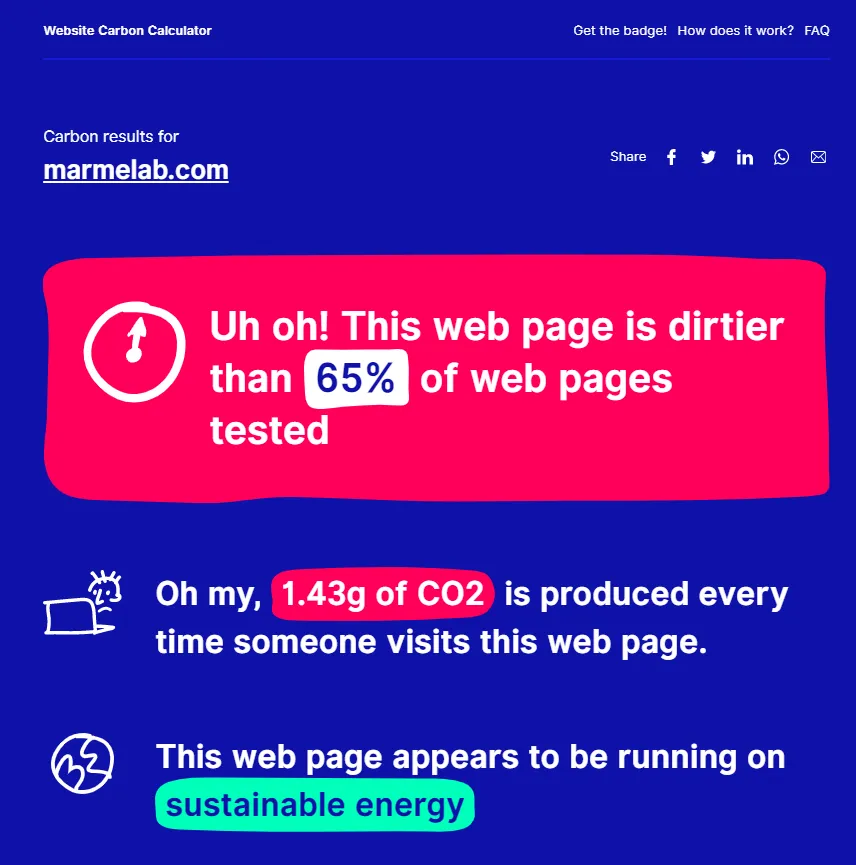
- websitecarbon.com
- EcoGrader.com/
- EcoMeter.org
- clickclean.org
- EcoIndex.fr
- Greenspector
- Microsoft Sustainability Calculator
- PowerAPI
You may think it’s already enough, but none of these tools give accurate or complete measurements, and they can’t be combined. Let me explain why.
Unverified Assumptions
None of these services actually measure Greenhouse Gas emissions. They measure DOM nodes, HTTP calls, server uptime, or the amount of JavaScript loaded by the browser. How these metrics relate to greenhouse gas emissions is a mystery.
We’ve spent a lot of time looking for scientific studies that produce robust models for the impact of digital usage. We’ve found a few good ones. But none of these models used the number of DOM nodes or HTTP calls.
Most existing tools use insight from the Web Performance Optimization (WPO) field. The idea is that if a service runs faster, it probably consumes fewer resources. Right? Well, not necessarily. If you multiply the number of web servers for a service, you’ll probably improve the perceived performance, but worsen the environmental footprint.
Partial View
The tools currently available evaluate only one part of the footprint - the client, the server, or the network part. For instance, the Microsoft Sustainability Calculator for Azure services assesses the footprint of your cloud servers. websitecarbon.com, on the other hand, focuses on the client-side.
But if you have to reduce the environmental impact of the client alone, the easiest way is to move some computation to the server-side - and vice-versa.
By optimizing only one part of a system, you risk moving the problem somewhere else in the system. Climate specialists call that a pollution transfer. It doesn’t change the overall system footprint.
Conflicting Models
Even though you manage to use several tools to measure both the server and the client-side footprint, since they rely on different models, their results cannot be compared - or added.
Just an example: scientists disagree on the global consumption of data centers, by a factor of up to 2.5:
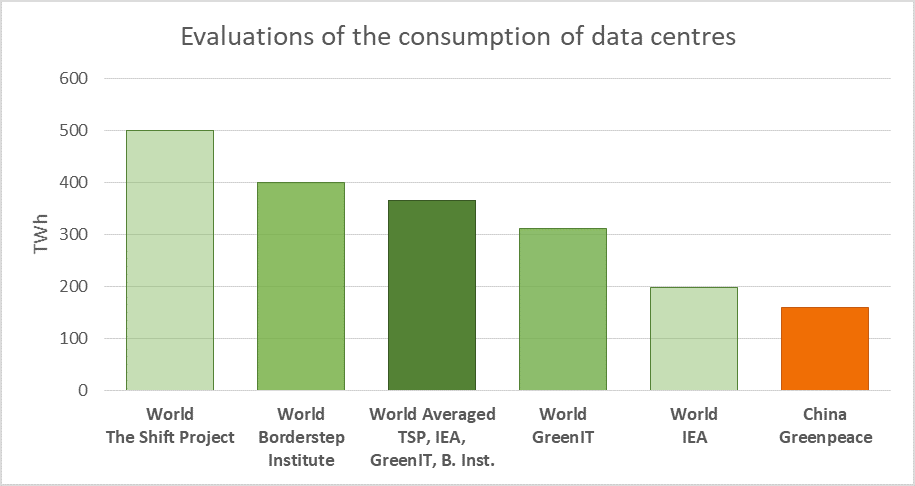
And that’s not the worst. For network traffic, studies vary by 4 orders of magnitude, from 136 kWh/GB down to 0.006 kWh/GB.
So unless you can use the same models to measure all parts of a system, the aggregation of the measurements of all parts won’t make any sense.
No Test Automation
One company in the list above really stands out: Greenspector. Their App Scan service runs a mobile app on real devices, and Greenspector measures real-time electricity consumption while executing a user scenario. They only measure the client-side energy consumption, but they do it accurately.
The Greenspector service is designed for one-shot impact audits. That means you can’t use it to compare the difference in footprint caused by a software change.
Imagine if you run your unit tests only once a year. They will fail, and you’ll quickly forget about them. The reason we care about unit tests today is that we are notified each time we break one, through continuous integration.
What Developers Need To Improve Their Practices
Based on the shortcomings listed above, I can draw the contours of a digital footprint measurement tool that could actually help developers change their practices. A tool that would have a positive impact. This tool should:
- be based on scientific models, with a reference to these models to make them verifiable.
- measure the footprint of the entire system required to run a service - the client, the server, the network, and the database.
- apply the same model to the client, server, network, and database.
- run continuously, and warn a developer when they caused a regression in the environmental footprint.
This would be the holy grail, saving developers from the doom of being huge global warming contributors.

Introducing Argos
We’re building that tool - codename Argos. We’ve named it after the Greek giant Argos Panoptes who has so many eyes he can see everything. But it’s such a cool name that too many products already use it, so it’ll likely change in the future.
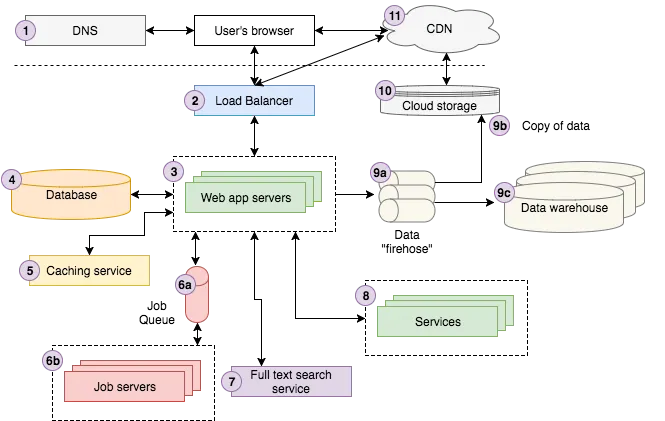
Argos Monitors A Digital System
Our tool uses Docker to encapsulate each component in a digital system and to measure its footprint. It uses Docker Compose to orchestrate all the components together.
Inside each component, Argos gathers technical metrics (CPU, Memory, Network I/Os, Disk I/Os) in real-time, and stores them in a database for further treatments.
That means Argos tracks the entire system: the frontend, the backend, the database, and the network.
Argos Simulates User Actions
Argos runs end-to-end tests on the frontend, simulating typical user scenarios. For instance, for an e-commerce site, Argos will simulate browsing a product list, searching for a product, clicking on a few results, adding a few items to the shopping cart, and checking out.
We run each scenario a dozen times to get a strong, accurate signal and reduce the standard deviation.
For web apps, we use Cypress, a great test automation tool for the browser. But any Robotic Process Automation (RPA) tool can do the job, be it on web or native apps.
Argos Is Based On Science
We convert the technical metrics gathered at the Docker level (CPU, Memory, Network I/Os, Disk I/Os) into Watt.hours. As it’s the same unit for all components of the system, we can add Watt.hours of all components to get an overall energy consumption of the digital system.
We’ve worked with French computer scientists from a common research lab of the University of Lorraine, CNRS, and INRIA. These researchers have spent countless hours reading the scientific literature on the subject and assembled a unique model of the environmental footprint of digital systems. We’re confident that our model is solid - as much as the papers it’s based on.

Argos Runs In Continuous Integration
The process of running an Argos test on a piece of software is fully automated. That means we can run an Argos test each time a developer makes a change, by putting Argos in the list of jobs run by a Continuous Integration service like GitHub Actions.
Developers get quick feedback about the overall change in environmental footprint. They can also dig down in the Argos report to understand where (in which components of the system) and when (at which point in the user tests) the footprint changed. This lets them link a change in code with a change in footprint.
Argos Is Not An APM
Argos doesn’t run in production. It’s impossible to determine the footprint of user devices in production, because we can’t put root-level daemons in user devices to gather them.
That’s why Argos works in a controlled environment, before the software is deployed to production. This brings an advantage: you can detect regressions in the environmental footprint in development, and fix them before deploying a new feature to production.
As such, Argos differs from an Application Performance Management (APM) tool like New Relic. These tools are great - and a great complement to Argos. But at best, they can only measure the server-side footprint.
Argos In Practice
Here is how we use Argos, and the type of feedback it produces.
Test Setup
We’ve tested Argos on the RealWorld project - a Medium clone available on Github, with implementations in many frameworks. We’ve chosen a frontend in React.js and a backend in Node.js.js, with a MongoDB database. We’ve created a docker-compose file to orchestrate the various components - a browser, a static web server, an API server, and a database. You can check the source for our test application on GitHub: marmelab/argos-realworld.
We’ve written user scenarios for the RealWorld app using Cypress, simulating a user commenting on an article, creating a new article, and logging out.
Test Run
Argos currently comes as a CLI tool - no fancy GUI yet. We use this CLI to:
- launch the RealWorld project,
- run
docker stats, a command to gather real-time metrics from all the running containers, - run the e2e tests, and
- store these metrics in JSON files.
We did that 10 times to compute an average of the metrics that reduces the noise.
./bin/argos.sh run ./my_project.yml --revision master --samples 10You can find the Argos CLI in the marmelab/argos-cli project on GitHub.
The resulting files contain thousands of records about CPU, Memory, Network I/O, and Disk I/O usage.
Running The Model
The next part is an aggregation and computation of these stats to transform the data into Watt.hours, based on the model we’ve built.
This model takes into account the consumption of the screen (in the browser component), the Power Usage Effectiveness (PUE) of the data center (for the server components), the consumption of idle CPUs, and other parameters.
For the test setup described above, the results look like the following:
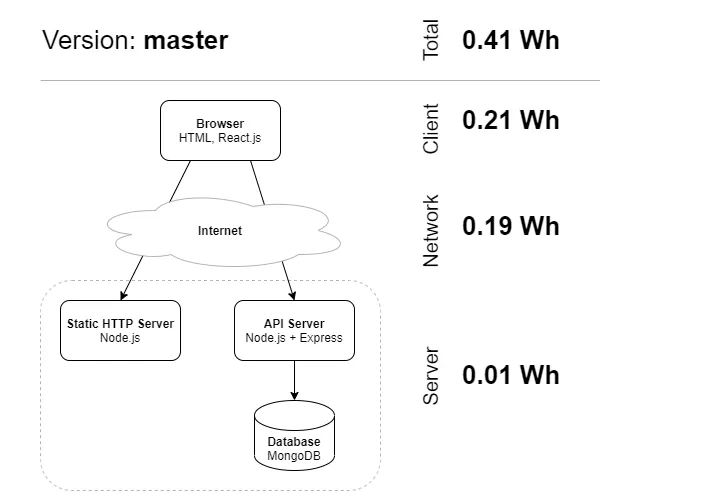
This doesn’t look spectacular, but it took us 6 months of research and development to get to a result that is both reproducible and realistic. As far as we know, no other tool allows measuring the footprint of an entire digital system. This is a breakthrough.
These figures already give great feedback about the power effectiveness of the RealWorld app. We learn that web servers consume much less energy than web clients in a typical usage scenario, which makes sense. After all, the client browser does complex layout and style computations to render web pages. Also, desktop computers use a screen, while server computers don’t. What’s most surprising is the relative share of the network.
We have a visual report with more details in the works, but it’s not yet ready for prime time. Until we release it, check this beautiful painting of Mercury and Argos by Peter Paul Rubens:

Comparing Two Revisions
The real actionable metrics come when comparing two revisions.
We updated the RealWorld code to make it more power-hungry. This may seem surprising, as the objective of Argos is to make apps leaner. But this helps prove our point: if we can see that this change increases the Argos estimate for energy consumption, it means Argos can also detect changes the other way around.
The change, which you can check in a diff file in the marmelab/argos-realworld repository, concerns the API: we made it return way more data than before.
We ran Argos again with the same Cypress e2e tests, but this time on the “broken” RealWorld app. Here are the results:
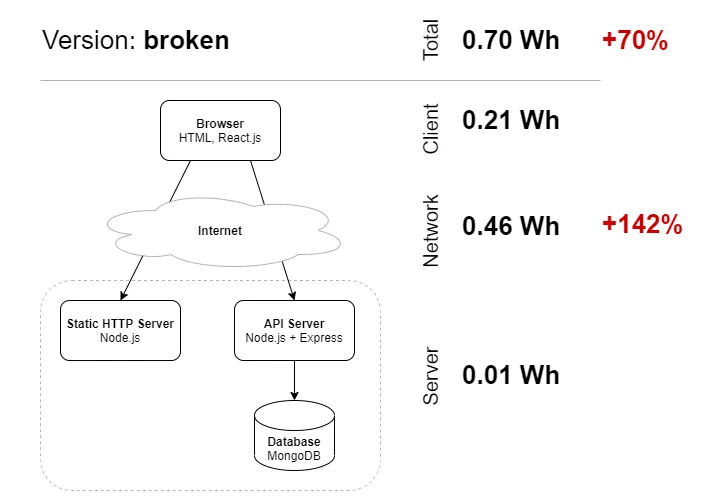
These are interesting results: The change is significant enough to alert the developer that they did something wrong. Also, although we changed the code in the server part, the main impact is on the network part. That’s because the server footprint isn’t impacted very much by the amount of data it transfers - after all, that’s what web servers are optimized for. If we had only monitored server stats, we’d have overlooked the drastic change in footprint caused by the diff.
You can see how developers can benefit from such feedback: if the change in power consumption appears as a comment in every pull request, developers will learn how to build more power-efficient software. Just like regression tests, performance tests, and security checks, the footprint test should help developers improve their practices.
Next Steps
We’re currently testing Argos on more web applications, using various software architectures, to battle test our model. We’re looking for volunteers who would be willing to test Argos on their applications to get even more feedback and fine-tune our model. Send us an email at contact@marmelab.com if you’re interested.
We’ve identified many improvements we want to work on, including:
- Computing a score in CO2 equivalent rather than in Watt.hours. We know that’s what companies need to estimate the footprint of their digital offering.
- Using Kubernetes as an alternative to Docker Compose
- Linking a footprint change to a precise code change
- Plugging Argos to a Real User Monitoring (RUM) service to get more accurate benchmarks
- Taking into account GPU usage (important for apps relying on Machine Learning)
We intend to use Argos for all our developments. After all, we are a digital innovation workshop, and running software is the main byproduct of our work - and the main contributor to global warming imputable to us. We want to build more sustainable software for our customers, and Argos is key to that.
We also plan to build a SaaS offering allowing anyone to plug Argos into their CI. Again, if you’re interested, send us a word at contact@marmelab.com. We’ll need some time to build that service, but you’ll be the first to hear about our progress, and to access our beta version when it’s done.
Conclusion
Our first efforts at building Argos, together with the company Les Tilleuls, already granted us an award for the Sustainable Digital Challenge co-organized by Google in June this year. Since then, Marmelab has invested more time and money to develop Argos. It’s been a rough journey because the field of sustainable digital is very young and full of uncertainties. We’ve tested many assumptions, some valid, and some invalid, to get to where we are today.
I’m already very happy about this initial proof of concept. I’m super impressed by the work of the Marmelab team who worked on Argos - Thiery, Florian, Julien, PEM, and Brice - kudos to them! And I’m excited to know what you think of it.
We know our future progression will be unpredictable. But we’re determined to make the world a better place using digital innovation. And Argos is going to be our main shot to accomplish this vision in 2021.
Stay tuned for more news about Argos!
April 2021 Update: We’ve invested a lot of time and love into Argos, and the product is now ready for public test. We’ve renamed it to GreenFrame for trademark reasons. You can test the footprint of your own web application at greenframe.io.
Authors
Marmelab founder and CEO, passionate about web technologies, agile, sustainability, leadership, and open-source. Lead developer of react-admin, founder of GreenFrame.io, and regular speaker at tech conferences.