
Digital Carbon Footprint: The Current State of Measuring Tools


Every web application has a digital footprint. What tools can we use to measure the environmental impact of our websites and how do they work? To answer these questions, we tested some of the main solutions on the GreenIT market.
Note: As Marmelab created GreenFrame, we’re of course biased, but this article provides all the links and sources to help you make your own opinion.
Digital Technologies: A Growing Burden on the Environment
Climate change remains the greatest global challenge we face today. The role of IT on the path to carbon neutrality is probably considerably underestimated. Although the impact of the IT sector on greenhouse gas emissions is only about 4% today, it’s growing extremely fast (8% per year) and will soon pass car emissions.
To reverse the current trend, many governments and companies have set ambitious targets to achieve carbon neutrality by 2050. While governments are pushing for new laws, companies will need to rethink their practices. Achieving the set targets will require a significant shift across value chains, including the IT value chain.
In addition to growing awareness, however, tangible solutions must be found to bring about a change for the better.
Measuring The Impact Of Digital Use
Digital technologies impact climate change when they are built (45%) and when they are used (55%). While there is more and more data about the “build” part (device manufacturers routinely publish fact sheets about the carbon emitted during the production process), estimating the “use” part is still a challenge.
There are a few solutions on the market that address this problem - including one that we’ve built ourselves. We compared their results on a typical website.
The website we used for our analyses is weather.com. With over 600 million visits per month, weather.com holds rank #76 of the most popular websites worldwide. The website’s digital footprint and consequently its environmental impact is therefore worth taking a look at.
We used six tools to compute an estimate of weather.com’s environmental footprint. The majority of these solutions, namely 4 out of 6, indicate the CO2 caused by the website.
- GreenIT Analysis
- Website Carbon
- Digital Beacon
- GreenFrame (our tool)
- Ecograder
- PageSpeed Insight
Here is a visual summary of the results:
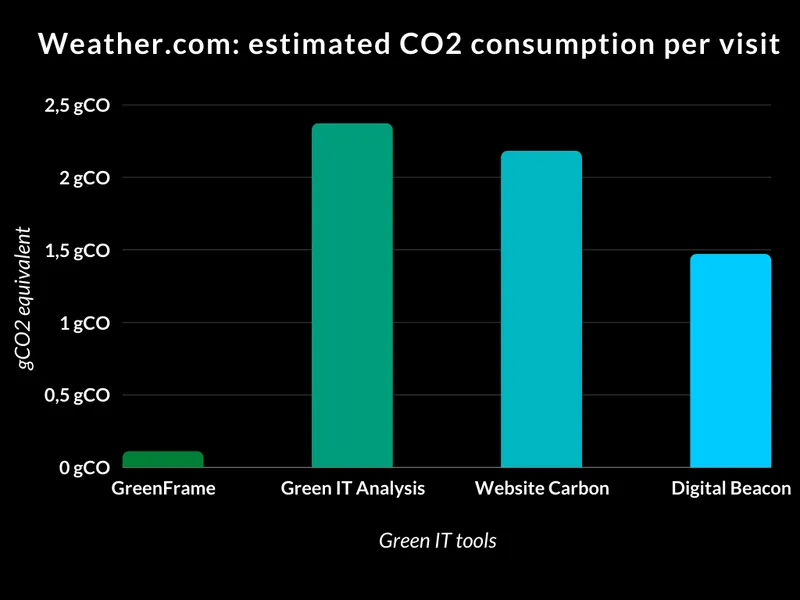
GreenFrame had the lowest estimate with 0.11 gCO2e per visit, while GreenIT Analysis estimated 2.37 gCO2 per visit, which is a baffling 21 higher than GreenFrame’s result. How can it be that there is such a significant gap between all the results? Let’s dive deeper into the analysis to get to the bottom of this question.
Note: We ran every test twice to see if the results would vary or not. Indeed, in many cases, the results vary drastically.
GreenIT Analysis
GreenIT Analysis is a browser plugin that estimates the energy consumption and CO2 emissions of the client and the network. It is a free and open-source tool edited by volunteers of the GreenIT Collective. In the case of weather.com, GreenIT Analysis comes up with the following results: water consumption amounting to 3.55cl and 2.37 gCO2e emitted per visit.
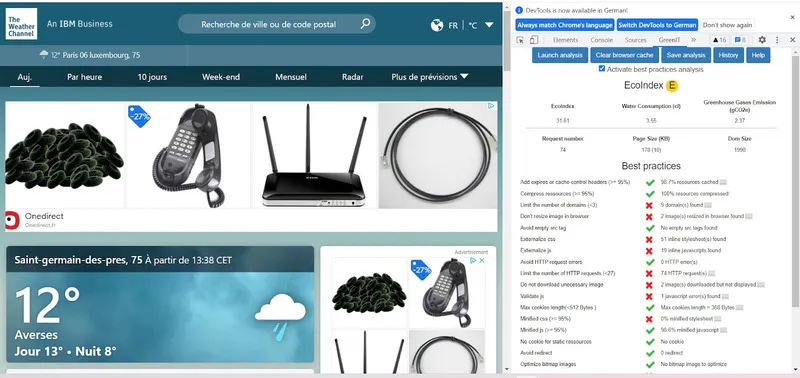
The estimate is based on the EcoIndex formula, which combines metrics gathered at the browser level representing the page weight and complexity. EcoIndex gives each site a score between 0 and 100. For weather.com, the Ecoindex is 31.61. It’s interesting to look at how Green IT derives carbon emissions from the EcoIndex score:
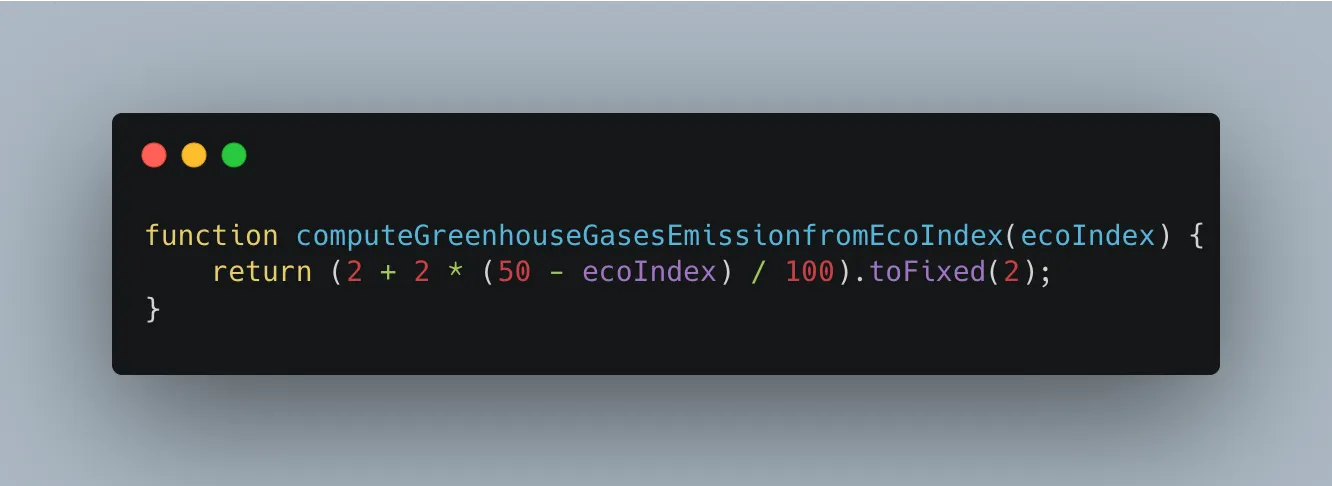
By construction, this score always returns between 1 and 3 gCO2 per visit (1g if the EcoIndex score is 100, 3g if the EcoIndex score is 0). According to the GreenIT collective, this formula comes from an unpublished study.
This raises 2 remarks:
- The emission limits seem arbitrary and disconnected from real use. How can an empty website emit 1g? How come watching a 1h long video never emits more than 3g?
- The EcoIndex itself is a combination of metrics of different units (page weight, number of HTTP requests, number of DOM elements) with “magic” factors. We couldn’t find any scientific study justifying these factors, that seem arbitrary and/or empirically derived.
GreenIT Analysis compiles a list of best practices and analyzes if the website implements them or not. However, even though there have been multiple publications on such “best practices” for eco-design, they are theoretical and no scientific study proves their correlation with CO2 emissions.
In conclusion, the CO2 emissions computed by GreenIT analysis seem to be a rough estimate based only on heuristics.
WebsiteCarbon
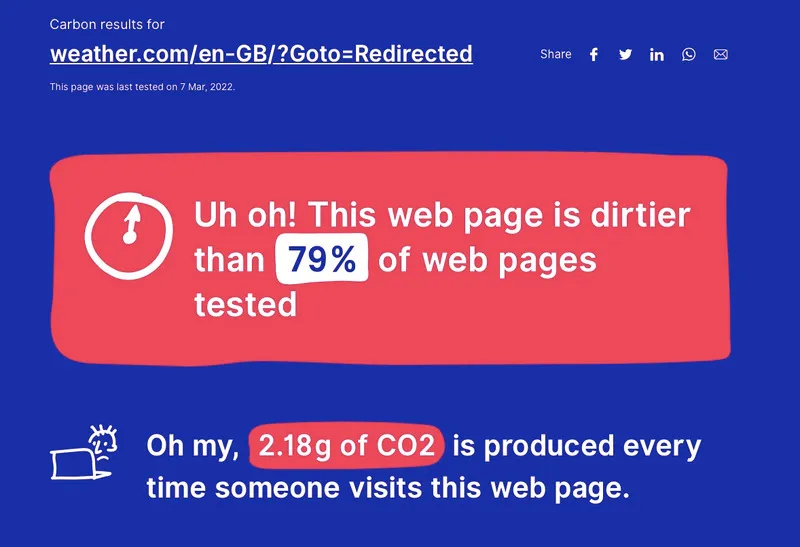
Website Carbon estimates the client’s CO2 emissions based on network traffic only. It is a free online service with open-source code. It estimates that every visit to weather.com emits 2.18 gCO2e.
The tool compares the website to previous analyses and gives additional information like what type of energy is being used.
The estimate is based on the following formula:
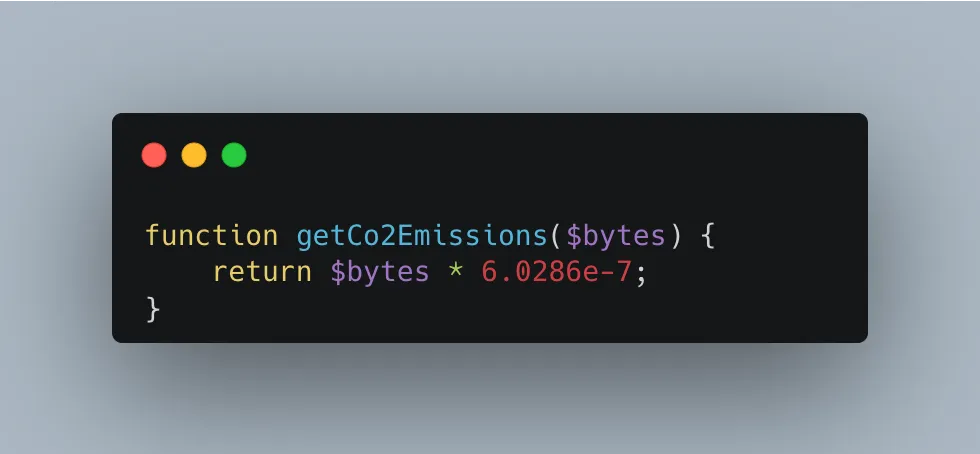
The numeric factor is derived from a 2015 study estimating the impact of internet traffic to 1.8kWh/GB. There is no scientific consensus on this score (in literature, this value ranges from 136kWh/GB to 0.006kWh/GB). More recent estimates of the energy intensity of data transmission (0.025-0.23kWh/GB) show that this 1.8kWh/GB factor is vastly overestimated. In addition, scientists conclude that the amount of data used by a page is much less significant than the time spent on this page.
In addition, by only looking at the network traffic, website carbon neglects the energy consumption of the user device (the screen, the CPU, the disk, etc.). But the impact of device use is estimated to be 1.25 times the impact of network use, so it should not be underestimated.
In conclusion, the CO2 emissions computed by WebsiteCarbon use an erroneous model that both overestimates the network and underestimates the device impact.
Digital Beacon
Digital Beacon computes CO2 emissions based on network traffic and the nature of the hosting provider. It is a free online service. When tested on weather.com, it estimates 1.47 gCO2e per visit and a page size of 1.94 MB. These results are broken down into Script, Image, Document, Other, Total, and Third-Party. The estimations from the runs vary by 6,80 %.
![]()
The actual formula used by Digital Beacon is not published. However, they explain that they use PageSpeed Insights and The Green Web Foundation. Indeed, the “size in MB” that Digital Beacon reports corresponds to the size estimated by PageSpeed Insights. As the CO2 estimate is based purely on traffic, we can deduce the data intensity factor that they use:
- 1.470g for 1.94 MB = 0.76g per MB = 758g per GB
According to The Green Web Foundation, weather.com isn’t using a green hosting provider, so Digital Beacon should use a worst-case scenario for electricity carbon impact. According to the IEA, the average worldwide carbon intensity of electricity is 475 gCO2/kWh. This gives:
- 758 g/GB / 475 g/kWh = 1.59 kWh/GB
This factor is close to the one used by Website Carbon and is overestimated by at least one order of magnitude for the same reasons.
And even though The Green Web Foundation may report a host as “green”, one should probably ignore it. As a matter of fact, anyone can add an entry for a provider and declare it as “green”. No verification is ever done (unless the provider pays The Green Web Foundation, which doesn’t seem to happen often).
Also, as Digital Beacon only accounts for network traffic and doesn’t take into account the energy consumption of the user device, its estimates are probably far from reality.
GreenFrame
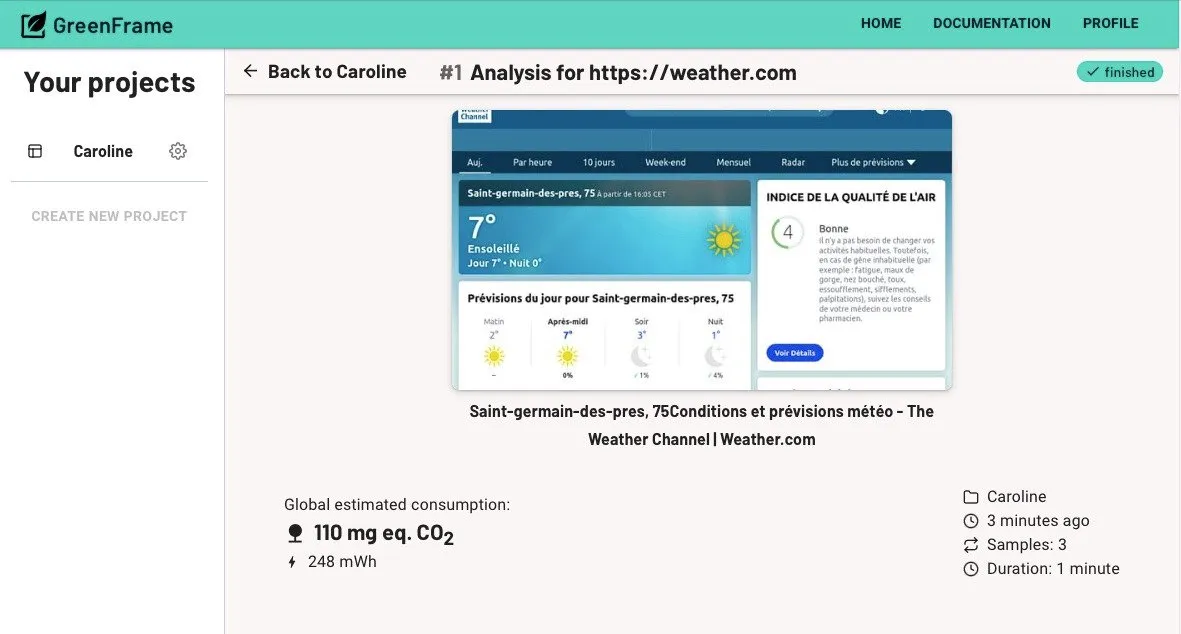
GreenFrame, edited by Marmelab, computes CO2 emissions based on system metrics and takes into account the entire system involved in delivering a web page (the screen, the visitor’s computer, the network, and even the data center when possible). GreenFrame estimates the carbon footprint of weather.com to 0,11 gCO2e per visit - one order of magnitude less than the other services.
GreenFrame doesn’t publish its formula, but explains the basis for its estimate as follows:
- Greenframe gathers metrics at the system level (time, CPU cycles, network traffic, disk usage, etc.) rather than at the browser level. For the client device, this gives a more complete view of the electric consumption. Besides, many studies have demonstrated a correlation between system metrics and energy consumption (while browser-level metrics, like the number of DOM elements, aren’t correlated with energy consumption). The collection script is open-source.
- Greenframe converts these system metrics into energy consumption (in watt.hours) using the conclusions of many studies and fact sheets (to list a few: study 1, study 2, study 3, fact sheet 1, fact sheet 2). The complete list of sources and the synthetic model are trade secrets, as they result from 6 months of research by French CNRS funded by Marmelab.
- GreenFrame adds the energy intensity of all the components, taking into account the Power Usage Efficiency (PUE) of datacenters
- GreenFrame computes CO2 emissions based on the carbon intensity of the electricity, by default a world average of 442 g/kWh, but this can be configured depending on the user base and data center localization
The result is a more accurate estimate of the CO2 emissions of a visit. In the case of weather.com, we only measured the client and the network footprint, but GreenFrame can estimate the impact of the server components (web server, database, storage, etc) when given proper access. In practice, the server footprint often represents less than 10% of the total footprint, so focusing on the client and the server is an acceptable approximation.
GreenFrame also focuses on repeatability: between 2 analyses, the estimate varies by less than 1% by default and can be improved by using longer usage scenarios and repeating tests. This means that GreenFrame can detect fine-grained changes in the system caused by a code modification.
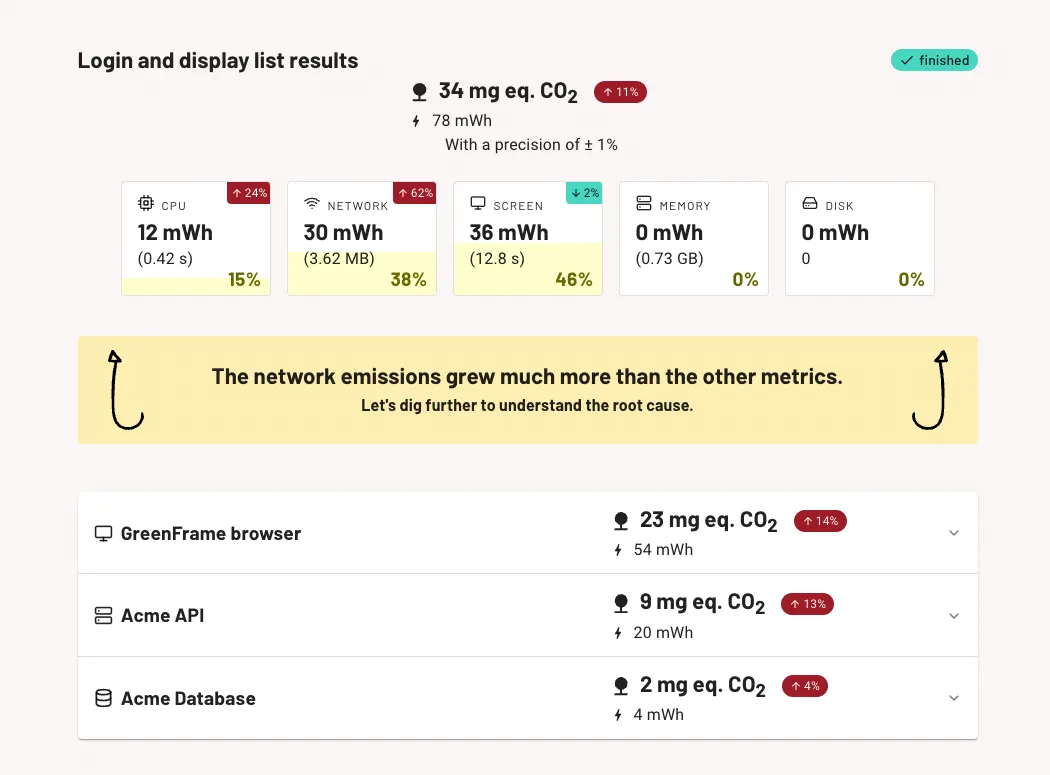
GreenFrame also includes actionable metrics, like the breakdown of emissions by component (screen, client, network) or the instantaneous energy consumption of the system. In the case of weather.com, the CPU is the main driver of CO2 emissions. This means that to reduce these emissions, the developer team should focus on the client-side JavaScript code and animations.
GreenFrame lets you write custom scenarios reflecting what people actually do on your website, so not just for simple visits!
Ecograder
Ecograder estimates a score out of 100 noting the “greenness” of a site. It is based on various client-side scores. It is a free online service. After running the test twice for weather.com, Ecograder gave two completely different scores. The first analysis came up with a score of 40, whereas the second time the result was 25 out of 100.
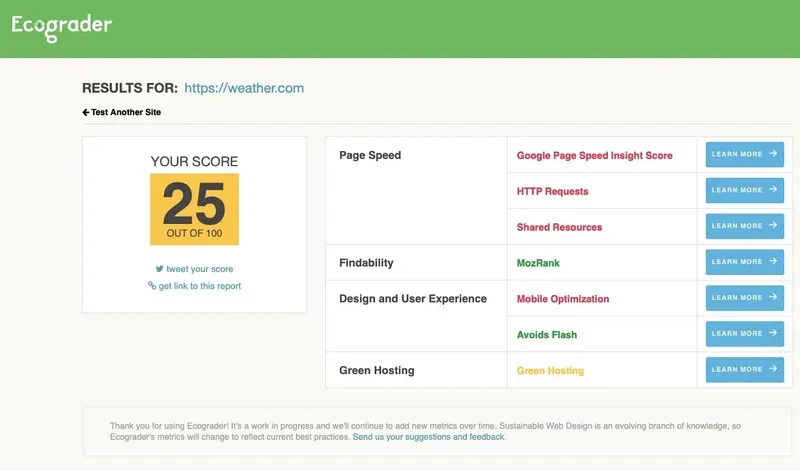
The EcoGrader formula isn’t public, but the FAQ explains its principle: Ecograder computes 6 individual quality scores from 1-10 regarding green hosting, findability, number of HTTP requests, page speed score, responsiveness, and use of Flash. It then combines these 6 scores into a 1-100 score using weighted factors that are not public.
Just like Digital Beacon, Ecograder uses PageSpeed Insights and The Green Web Foundation.
The calculation has no scientific foundation, varies by more than 60% between runs, and uses a proprietary score than can’t be compared with other tools. The fact that it focuses on outdated practices (not using Flash, using JS libraries from CDNs) isn’t reassuring.
PageSpeed Insights
PageSpeed Insights is an online web page performance audit service offered by Google. It measures key web performance metrics like First Contentful Paint and First Input Delay. In addition to the estimate, it lists suggestions for improvement afterward. It is a free service with an API.
The first time around, Page Speed Insight gives weather.com the value 73 out of 100, while the second tour comes up with the value 66 out of 100.
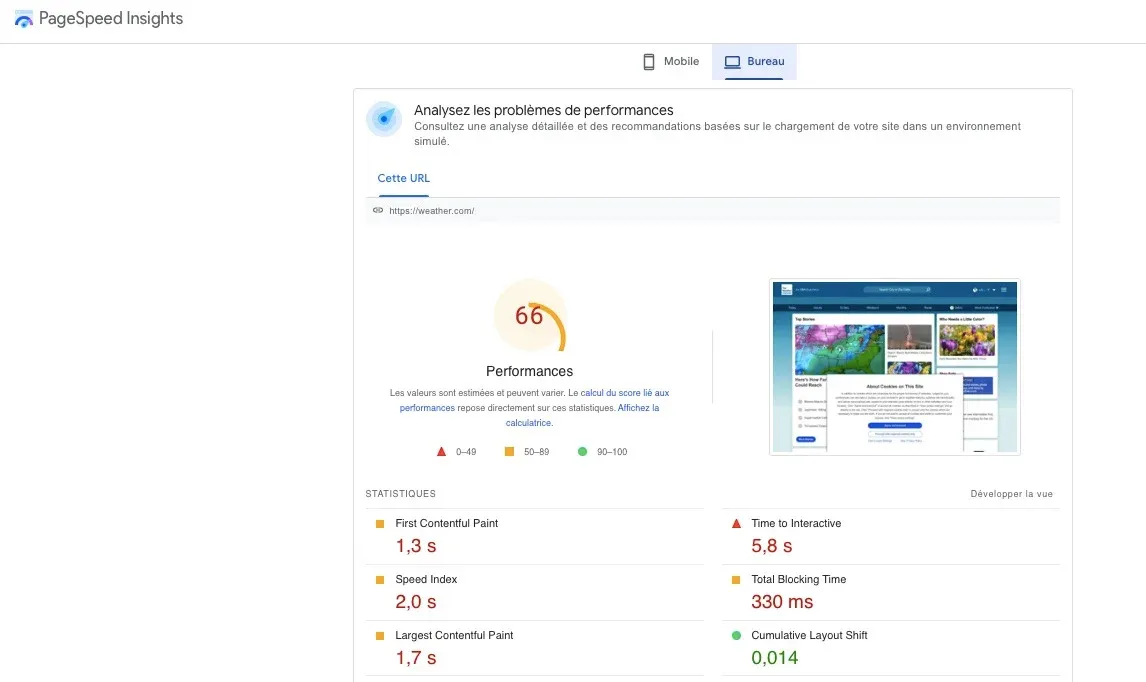
PageSpeed Insights gives an aggregate performance score and metrics in seconds. It works by visiting a URL using a headless browser and gathering metrics at the browser level. It does not compute an estimate of the environmental impact.
While the web performance might have an influence on the web application’s carbon footprint, these two aspects should not be equated. This fact is something that the CTO and the developers at the newspaper LeMonde realized after weeks of working on reducing the CO2 emissions caused by their website.
In Sacha Morard’s, CTO at LeMonde, own words: “We naively thought that by optimizing our web performance, we would also optimize our carbon footprint. Our site is highly optimized when it comes to web performance, but that doesn’t necessarily mean that it doesn’t consume a lot of energy. Some web performance optimizations are bad when it comes to carbon emissions and vice versa. We realized that these are two separate battles, however, it’s best to fight them together.” This should be kept in mind when using the tool Page Speed Insight.
Besides, PageSpeed Insights results vary a lot between 2 runs, which doesn’t make it a good fit for continuous improvement.
Imperfect Models Ask For Continous Analyses
The results above vary a lot for a simple reason: there is no scientific consensus when it comes to the impact of the use of software. Depending on the study they are based on, different tools give different results. A second factor is that measuring the CO2 emissions of a digital system is hard, and it’s easy to fall into the trap of using a simplistic model.
To put it differently, all estimates are wrong - GreenFrame included. We tend to believe that GreenFrame is a bit less wrong than the others, because we’ve built it using a scientific approach, based on results from scientific studies, and we verified the results through experimentation. But with no scientific consensus, it is difficult to state which solution is the closest to the truth. So how do we proceed now?
We believe that focusing on the accuracy of a one-time measurement is asking the wrong question. To reduce the carbon footprint of a digital service, developers need to determine if a change they make has a positive or negative impact. Computing the difference between two analyses is the key to this.
GreenFrame was designed for this usage. It can run in the Continuous Integration. Each time a developer pushes a change to the application code, GreenFrame analyses the new code. If the CO2 emissions pass a certain threshold, GreenFrame alerts the developer. We’ve verified that the changes in GreenFrame estimates go in the same direction, and in the same proportion, as the actual changes in CO2 emissions. That’s enough to start a Carbon reduction strategy.
Conclusion
Awareness of the impact of digital on the environment is growing. More and more companies start taking action to actually reduce their digital footprint. But the state of the art of online measuring tools is still far from ideal.
That’s why we built GreenFrame - created as a tool to measure the emissions of the web applications we build for our customers. Now that it’s been tested by hundreds of customers on thousands of websites, we believe it’s good enough for most companies, and we encourage you to test it at greenframe.io. It’s free for one month, no credit card is required, and all the features are unlocked.
Whatever tool you choose, if you’re a company that develops and publishes a web application, the best time to act on reducing your carbon emissions is yesterday. The second best time is today. So let’s fight climate change together!
Authors
Marketing Manager, Caroline works to increase the visibility of Marmelab and the products we publish, especially react-admin and Atomic CRM. She has many talents: avoid challenging her at foosball!
Marmelab founder and CEO, passionate about web technologies, agile, sustainability, leadership, and open-source. Lead developer of react-admin, founder of GreenFrame.io, and regular speaker at tech conferences.