
Argos: Comparing the Energy Consumption of Two Web Stacks

In a previous article, we have presented Argos, a tool that measures the environmental footprint of software.
In order to make our tool more robust and more accurate, we made many experiments. One of them consists of measuring the energy consumption of the same application, implemented using several web stacks: Rails or Node.js for the backend, React.js or WebComponents for the frontend. We have cloned and tweaked implementations of the RealWorld app, a Medium.com clone available on GitHub, so that frontend and backend apps can work together and produce the same results for any of the four possibilities.
In this article, we present the measures performed by Argos. We also present what we have learned, what we know, but also what we still don’t know.
Argos in a Nutshell
Argos is an energy footprint calculator for web and mobile apps. It runs end-to-end tests on the frontend, simulating typical user scenarios. The monitored application runs in Docker containers. Argos tracks the entire system: the frontend, the backend, the database, and the network. Argos uses the docker stats API to gather technical metrics (CPU, Memory, Network I/Os, Disk I/Os) in real-time, then converts these metrics into a uniform energy unit: Milliwatt-hour (denoted mWh).
Argos is the result of months of R&D at Marmelab. It’s currently in private beta.
For our test of the RealWorld app, Argos simulates browsing a list of articles, logging in as a registered user, adding a comment to an existing article, creating a new article, and logging out. For this simulation, we use Cypress, a great test automation tool for the browser.
Zoom In the Argos Model
Argos uses an energy consumption model that depends on several parameters that can be arbitrarily set to model a given context.
In the presented experiment, we consider a CPU unit (Intel® Core™ i7 - 9th generation) with an average power of 45W; the considered device has a 14” screen whose average power is evaluated to 14W. As for the network consumption, we have considered a value of 11 Wh/GB, which is an optimistic estimation.
There is no consensus in the scientific community on the energy consumption of network traffic. The paper The energy intensity of the internet: home and access networks explains that there is not a single value for defining the network energy consumption. Another paper, Evaluating the Energy Consumption of Mobile Data Transfer, which is highly cited, proposes an estimation of 60 Wh/GB in 2015. This value tends to be lower than 10 Wh/GB in 2020. Another study, Electricity Intensity of Internet DataTransmission, identifies representative estimates for the average electricity intensity of fixed-line Internet transmission networks over time. Our model uses 11 Wh/GB, but you can see it as a parameter of the system, which can be fine-tuned to model different networks, depending on the context.
Benchmark Setup: Node/React vs. Rails/Vanilla.js
We have tested Argos on four different implementations: a backend in Node.js, a backend in Rails, a frontend in React.js, and a frontend in Vanilla.js+WebComponents.
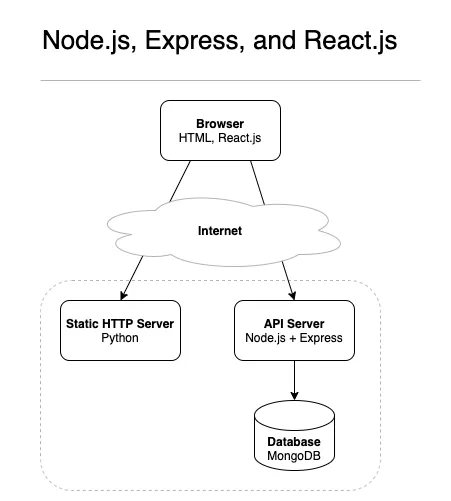
We have created several docker-compose files to orchestrate the various components: a browser, a static web server, an API server, and a database. We run the test on a desktop client.
You can check the source for our test application on GitHub: marmelab/argos-realworld.
Since we compare two different architectures, the data exchanged between the components are not always equal. For instance, the backend in Node.js integrates a MongoDB database, whereas the backend in Rails uses SQlite. The latter uses disk access instead of network access to transfer data. We’ve normalized the data presented later in this article to make them comparable.
Macroscopic View: Servers Emissions Are Negligible
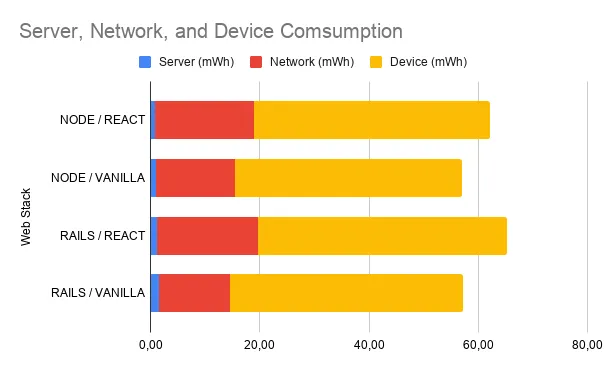
When comparing two applications, Argos provides an overview showing the repartition of energy consumption between the Server, the Network, and the Device:
- Server corresponds to the infrastructure used to host and execute the API and the database. This also takes into account the Power Usage Effectiveness (PUE) of the data center hosting the computers.
- Network corresponds to the data transfer between the different components of the application.
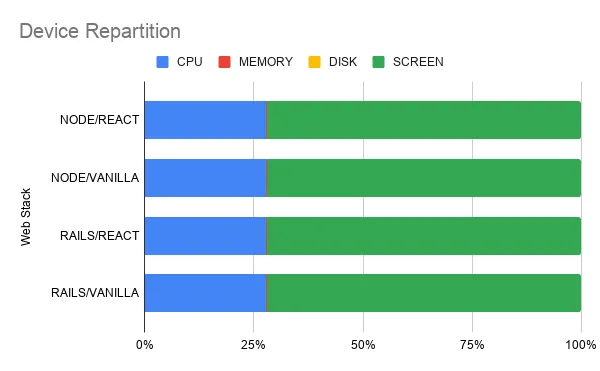
- Device corresponds to the energy used to run the device (CPU, Memory), but it also takes into account the screen whose energy consumption is important.
We can see that an application with a front written in Vanilla.js+WebComponents consumes a bit less mWh than the same application written using React.js. This is somewhat expected, as React.js embarks an entire view framework with a VirtualDOM implementation, while WebComponents rely on native browser APIs for rendering.
As we can see on the repartition shown below, from 69% to 74% of the total energy used to run the application is used by the device. The Network is comprised between 23% and 29%. And the Server only counts for less than 2% of the total.
We explain this by the fact that the RealWorld backend does not perform intensive computations. Indeed, displayed pages contain a low amount of data, and the database is pretty empty, so the server-side treatments are minimal. On the other side, the client device does much more: HTML, CSS, and JS parsing, JS compilation, rendering, painting, input capture, transitions, etc. Finally, the client device is dedicated to the scenario, while the server is normally shared between all clients.
A study by GreenIT mentions that the energy consumption of an application corresponds roughly to 46% for usage, 32% for the network, and 22% for the server. Our experimental protocol tends to give even lower importance to the server.
Fine-Grained Analysis: Memory and Disk Emissions Are Negligible, Screen Emissions Dominate
In this section, we analyze for each component of the application which part of the system is responsible for most of the energy consumed. As we will see, this can be the CPU, the network, but also the screen, which is a power-hungry component.
API and DB: Most of the Energy Consumption Is Due To CPU Usage
As illustrated below, for the measured RealWorld API, most of the energy consumption is due to CPU usage. The energy consumed by memory is very low, and the one corresponding to disk usage can be neglected.
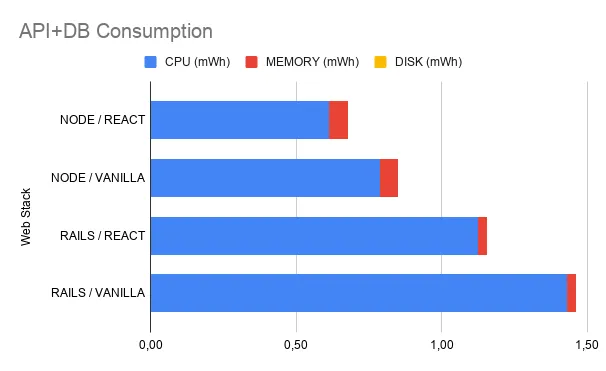
At first, this graph confirms our intuition that a Node.js backend should use less energy than a Rails backend. However, it raises several questions. In particular, we can remark that for a given backend (either Node.js or Rails), the energy consumption is higher when using Vanilla.js+WebComponents than when using a React.js frontend. Unfortunately, we currently don’t have any good explanation. This is not a sampling bias, as we’ve repeated the measurements many times and got the same results. One explanation could have been that more data are transferred when using Vanilla.js+WebComponents. But this is not the case. Even more, as illustrated in the Network section below, the use of Vanilla.js+WebComponents reduces by a small margin data transfers, compared to React.js.
Database: Less Than 0.2% of Total Emissions
For the Node.js backend, the total energy consumed by the database is very low: 0.12 mWh. This has to be compared to 0.57 mWh for the API, which represents only 0.96% of the 62.2 mWh used by the Node.js/React.js application). For the database, a big part of the energy consumption is due to CPU usage: 61% for CPU, 39% for memory, and 0% for the disk.
Web Server: The Web Stack Does Not Have a Big Impact on The CPU Usage
Our application embeds a Python web server for static assets, and a dynamic server (either Node.js or Ruby) for the API. As illustrated below, the CPU consumption of these components is very low (less than 0.1 mWh). Since we are comparing very small numbers, we cannot conclude that a given stack is better than the other.
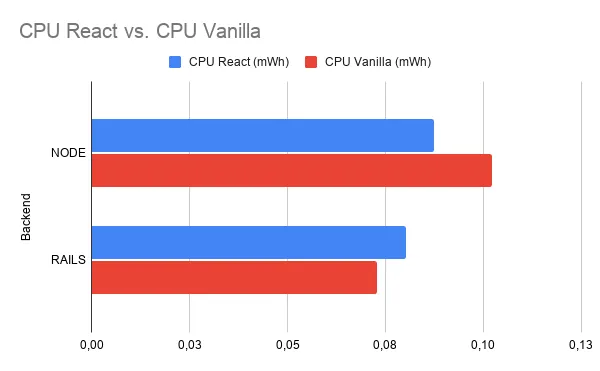
Once again, the energy consumed by the memory is low (between 7% and 14% of the total). The energy consumption due to disk usage can be neglected.
Device: The Screen Consumes 72% of the Energy
The first thing we note is that 41.7 mWh are necessary to run an application written in Vanilla.js+WebComponents. This has to be compared to 43.2 mWh for a front written in React.js. Again, the fact that React.js consumes more resources than Vanilla.js+WebComponents corresponds to our intuition, but the margin is very thin.
Comparing now the repartition, we have an impressive result: we note that the energy consumption due to memory usage is very low (0.2%), but we also remark that the energy consumed by the screen corresponds to almost 72% of the total energy used to run the device.
The execution of our Cypress scenario takes 8 seconds. Our 14” screen, whose power is evaluated to 14W, has to be lighted on during these 8 seconds, and thus the energy consumed is 31.1 mWh. This has to be compared to 0.96 seconds needed by our Intel Core i7, whose power is evaluated to 45W. 0.96 x 45 / 3.6 = 12.0 mWh.
Network: From 23% to 29% of Total Emissions
As seen previously, the network corresponds to an important part of the energy consumed by the application. This ranges from a total of 13.1 mWh to 18.5 mWh. But what surprised us is that this value depends on the technology used: the network consumption should be more or less the same when using React.js or Vanilla.js
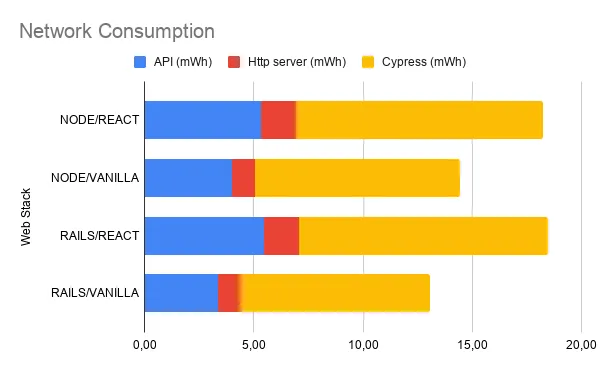
An explanation is that the React.js and the Vanilla.js implementations have been done by different teams and their behavior is not 100% the same. For instance, in the initial implementations, a favicon was loaded in the React.js implementation but not in the Vanilla.js implementation. In Vanilla.js, all transferred data were gzipped, and this was not the case in React.js. The downloaded JS bundles do not have the same size in both implementations. We have tweaked the implementations to make them as comparable as possible, but some small differences still remain. This mostly explains why the network consumption is not the same for all implementations.
Conclusion
In this blog post we have presented the measurements performed by Argos on a real-size application, RealWorld, implemented using four different technologies. To the best of our knowledge, this is the first time that the energy consumption of an entire system, i.e. the frontend, the network, but also the backend, and the database, can be easily measured and analyzed.
Most of the results confirm our intuition, and may not be spectacular. Yet it’s the first time they are confirmed experimentally. Some of the results raise interesting questions. The prevalence of the client over the server challenges the ubiquity of the Single Page App architecture. Also, the importance of screen consumption (in a desktop client) validates efforts to improve the performance of web apps: the longer it takes for a user to achieve a task, the more energy they consume.
But take these results with a grain of salt: they come from a simple, small app, and need to be confirmed by testing more complex apps and user scenarios. In future work, it would be interesting to compare a Node/React SPA with a full-stack Rails app, without JS. This would allow us to compare architectures (SPA vs SSR) instead of languages, and would probably show a bigger impact. But at present, there is no such RealWorld implementation yet.
If you want to test Argos on your apps, or on the apps you build for your customers, contact us. We’re currently running tests with selected partners, and we’re looking forward to measuring more real-world apps with Argos before we can open it to the public.
April 2021 Update: We’ve invested a lot of time and love into Argos, and the product is now ready for public test. We’ve renamed it to GreenFrame. You can test the footprint of your own web application at greenframe.io. And it’s only the beginning: We’re working on a SaaS product to integrate GreenFrame into Continuous Integration pipelines!
Authors
Software Engineer and researcher in formal methods. Over the last 20 years Pierre-Etienne has contributed to the development of new programming languages as well as techniques to improve software quality. Pierre-Etienne has a PhD in Computer Science, he has published more than 40 papers in international conference. He is also a road cycling enthusiast.